67
4.2 Software
4.2.1 Adjusting the Response Graph
The Response graph axis are defaulted to autoscale as the signal changes. However, it can be desirable
to zoom in or out on certain areas of the graph as test progresses.
The graph can be moved in the x and y axis by holding the right mouse button and dragging
the mouse.
The graph can be zoomed in and out by holding the middle mouse button and selecting a
boxed area to zoom in to.
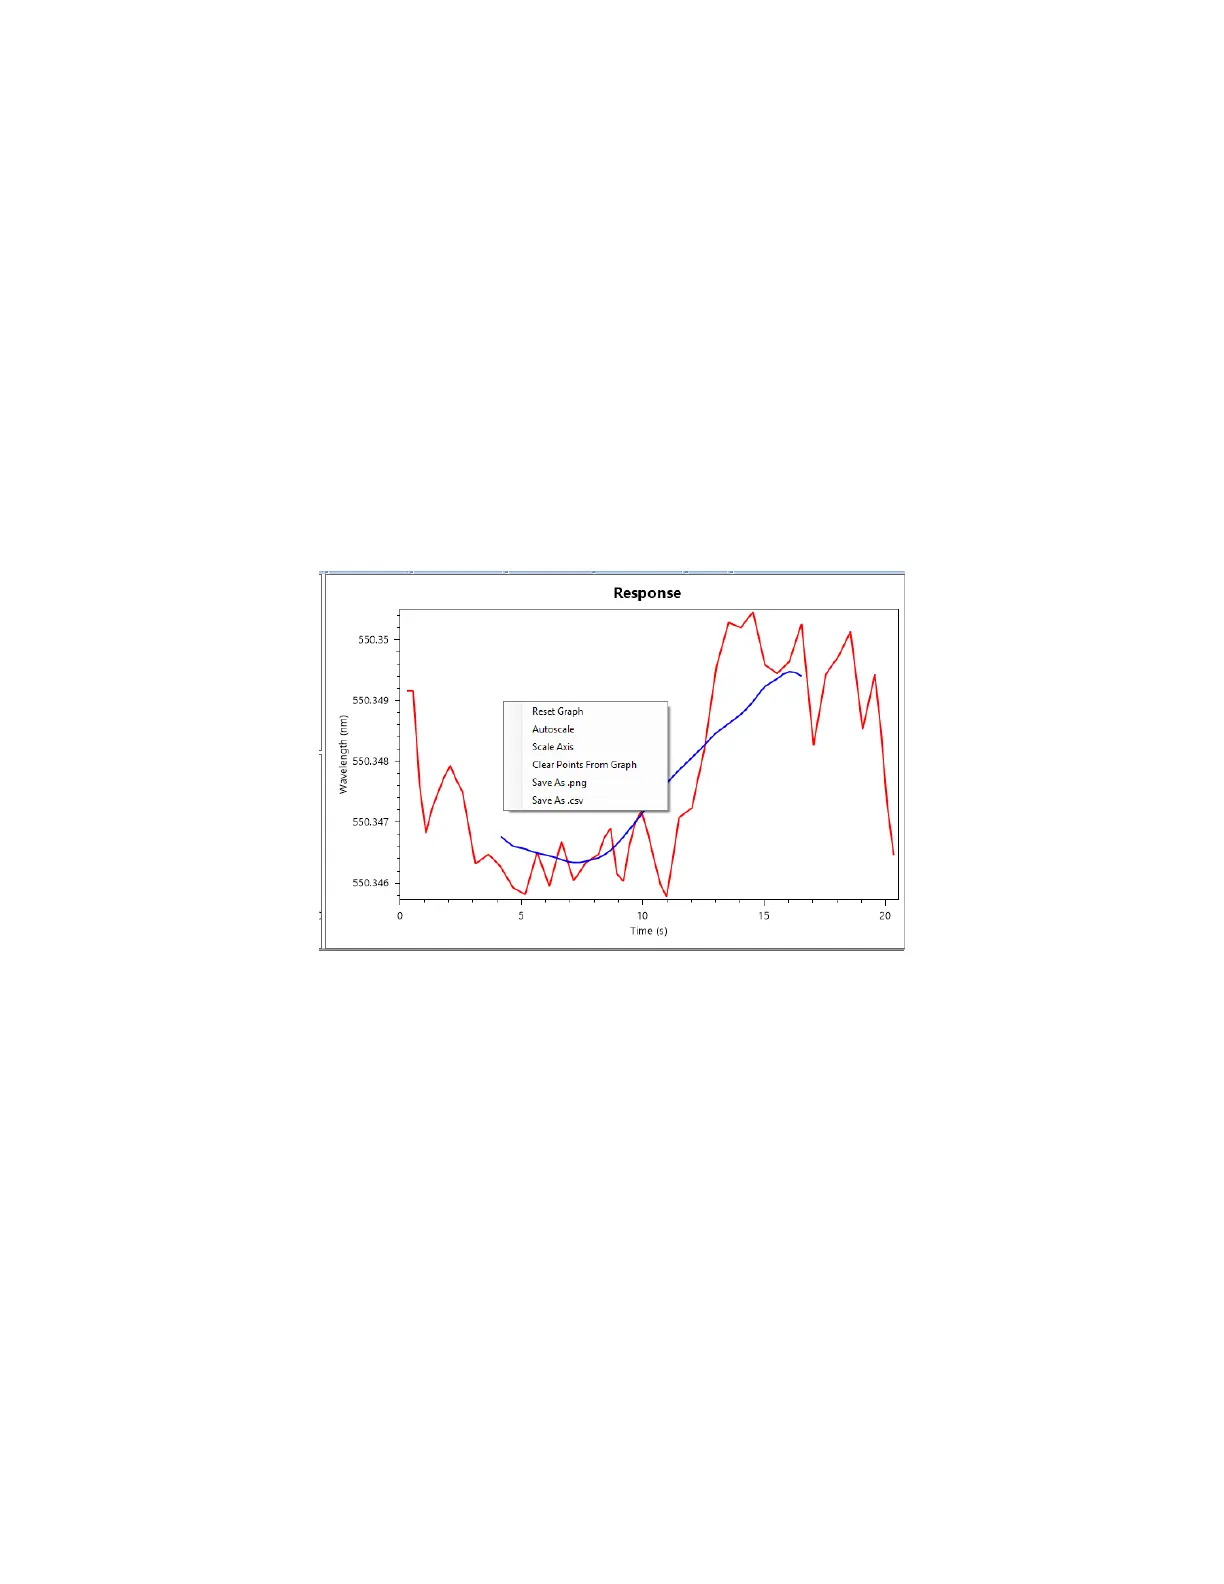
The axes of the Response window can be adjusted to view the data better by double right
clicking on the graph. A menu will open with a number of options [Figure 4.16].
Figure 4.16 - Graph options menu that appears by double right clicking on the graph.
Reset Graph – Clicking this will return the graph to its previous settings. For example, if you
zoom in on the graph and want to return to your original view, click “Reset Graph”. This can
be especially helpful if it appears the graph is not updating.
Autoscale – Autoscale will automatically set the x and y extents of the graph to enable viewing
of all of the data in the graph.
Scale Axis – This opens the x and y max and min settings for the graph. Here the user can enter
the exact x and y max and min that they would like to have.
Clear Points from Graph – Clicking this option will remove all of the current data points from
the display. Note that the data will NOT be deleted from the data file, just removed from the
display. This feature is useful if performing long tests as the software may begin to slow down
after 10,000 data points are displayed. If the software begins to slow, clearing the data points