32
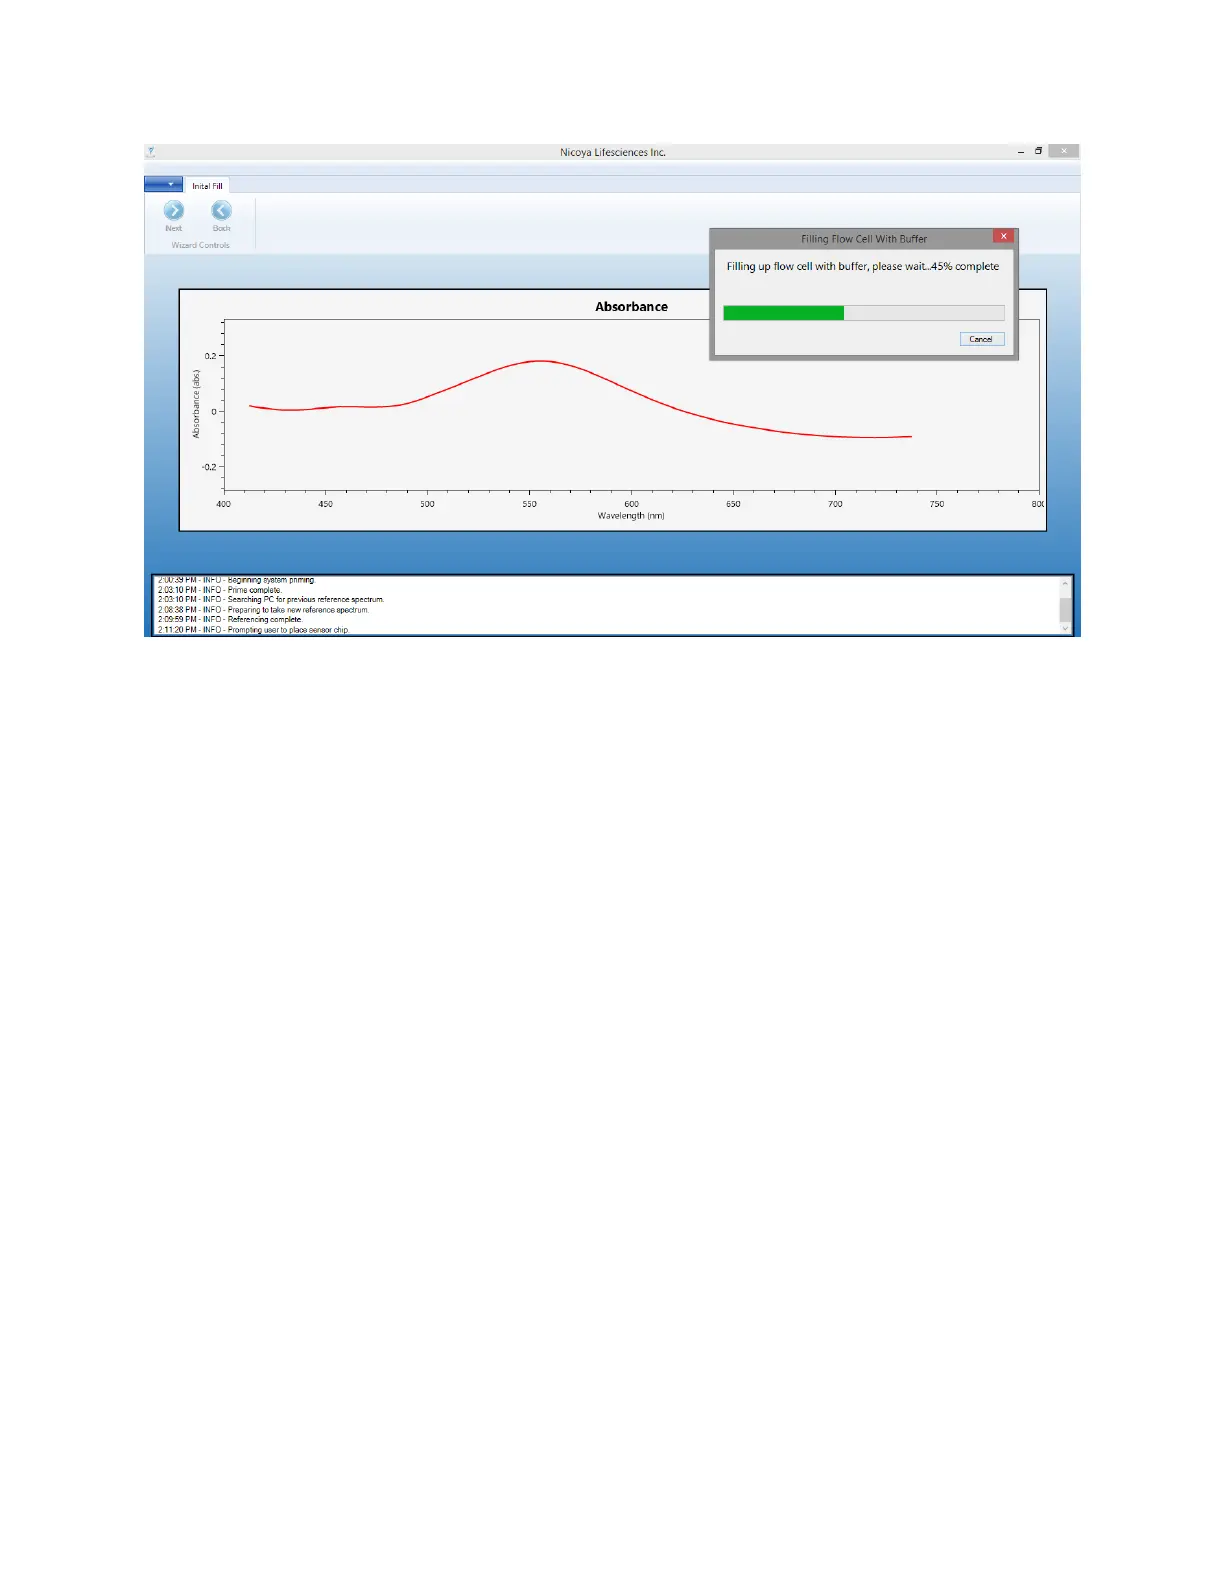
Figure 2.12 - Filling Flow Cell progress bar with strong Gaussian absorbance peak of Sensor Chip.
8. After the Flow Cell has been filled, the software will automatically find and fit the absorbance
peak of the sensor. The peak fit will be displayed as a green line along the curve of the
absorbance peak.
9. Click “Next” to proceed to the next steps.
2.2.4 Bubble Removal & Cooling
1. Once the peak has been found, real time data will begin streaming into the “Baseline” graph
on the right side of software window [Error! Reference source not found.]. The Baseline graph
shows the absorbance peak position on the Y-axis and time on the x-axis (in seconds). This
graph is used to monitor when a consistent sensor baseline is achieved. This screen also
contains the controls needed for bubble removal and to set the sample compartment
temperature as well as the XT autosampler status.