55
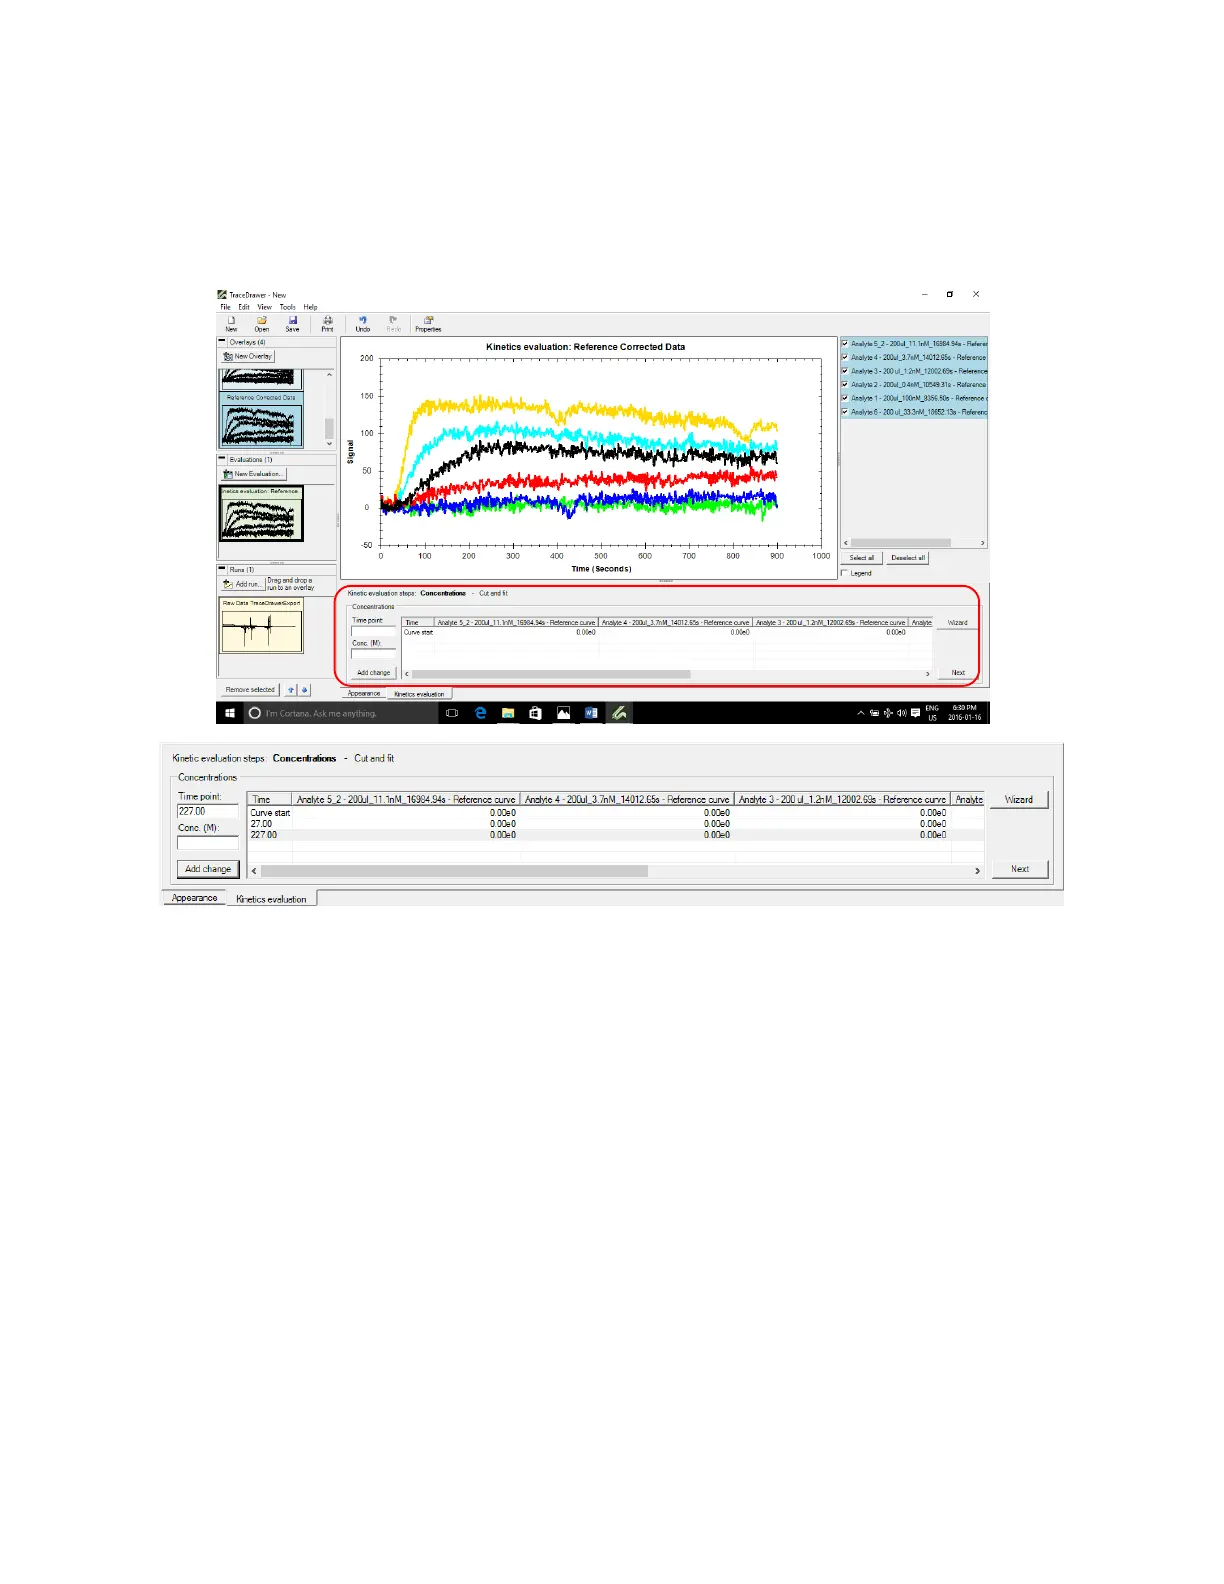
11. In the Time point box, enter the time for the start of concentration change and press Add change.
This can be interpreted as the X value where Y=0 before all curves start to rise. Similarly, add the
end of concentration change by summing the association time period with the start time of
concentration change (For example: 27s+200s=227s).
Figure 3.18 - In Kinetics Evaluation tab at the bottom of the screen, enter the times for the start and end of sample
concentration.
In the table, right click on the row for start of concentration change and press Use curve property
concentration to import the concentrations entered when the original run was created (note –
you must have entered the concentrations into the curve properties for this to work) [Figure
3.19].The concentration of curves at end of concentration change is zero. These values can be
entered manually if needed.