57
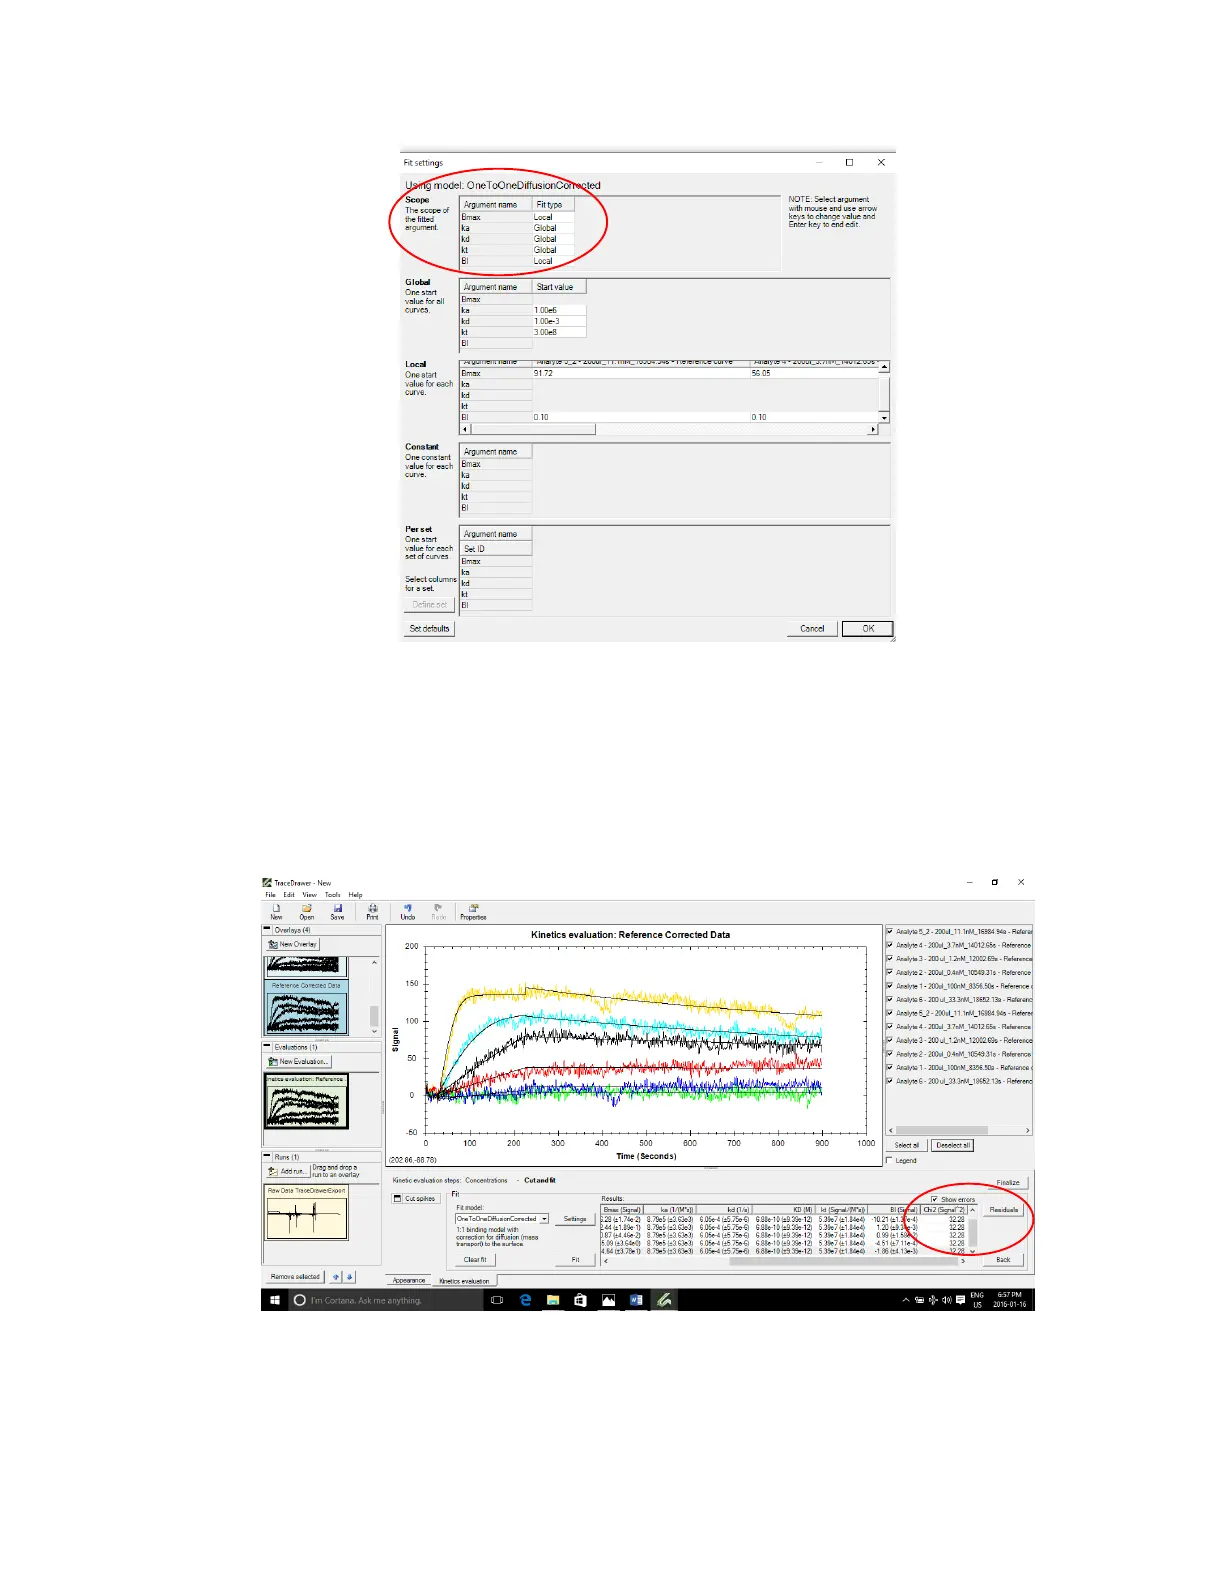
Figure 3.21 - Fit Settings window that appears when Settings button is clicked. Ensure ka, kd and kt are set to Global.
Then press Fit.
A good fit will closely approximate the responses. Check show errors and scroll to the right to see
Chi2 value. Press Residuals to show deviation of actual response from the fit curve. Small errors,
Chi2 and residuals are indications of a good fit.
Figure 3.22 - Calculated results after Fit was applied. Show errors is checked to evaluate whether the fit is good.