3-103
3 Functions of NB-Designer
NB-series Programmable Terminals NB-Designer Operation Manual(V106)
3-6 Parts
3
3-6-7 XY Graph
The area used for storing data can be calculated with those formulas as follows.
Standard or Track: 20 + Sampled pages x 4 + Sampled pages x Sampled points x Number of
Channels x 2
Trend: 20 + Sample pages x Sampled points x 4 + Sampled pages x Sampled
points x Number of Channels
6
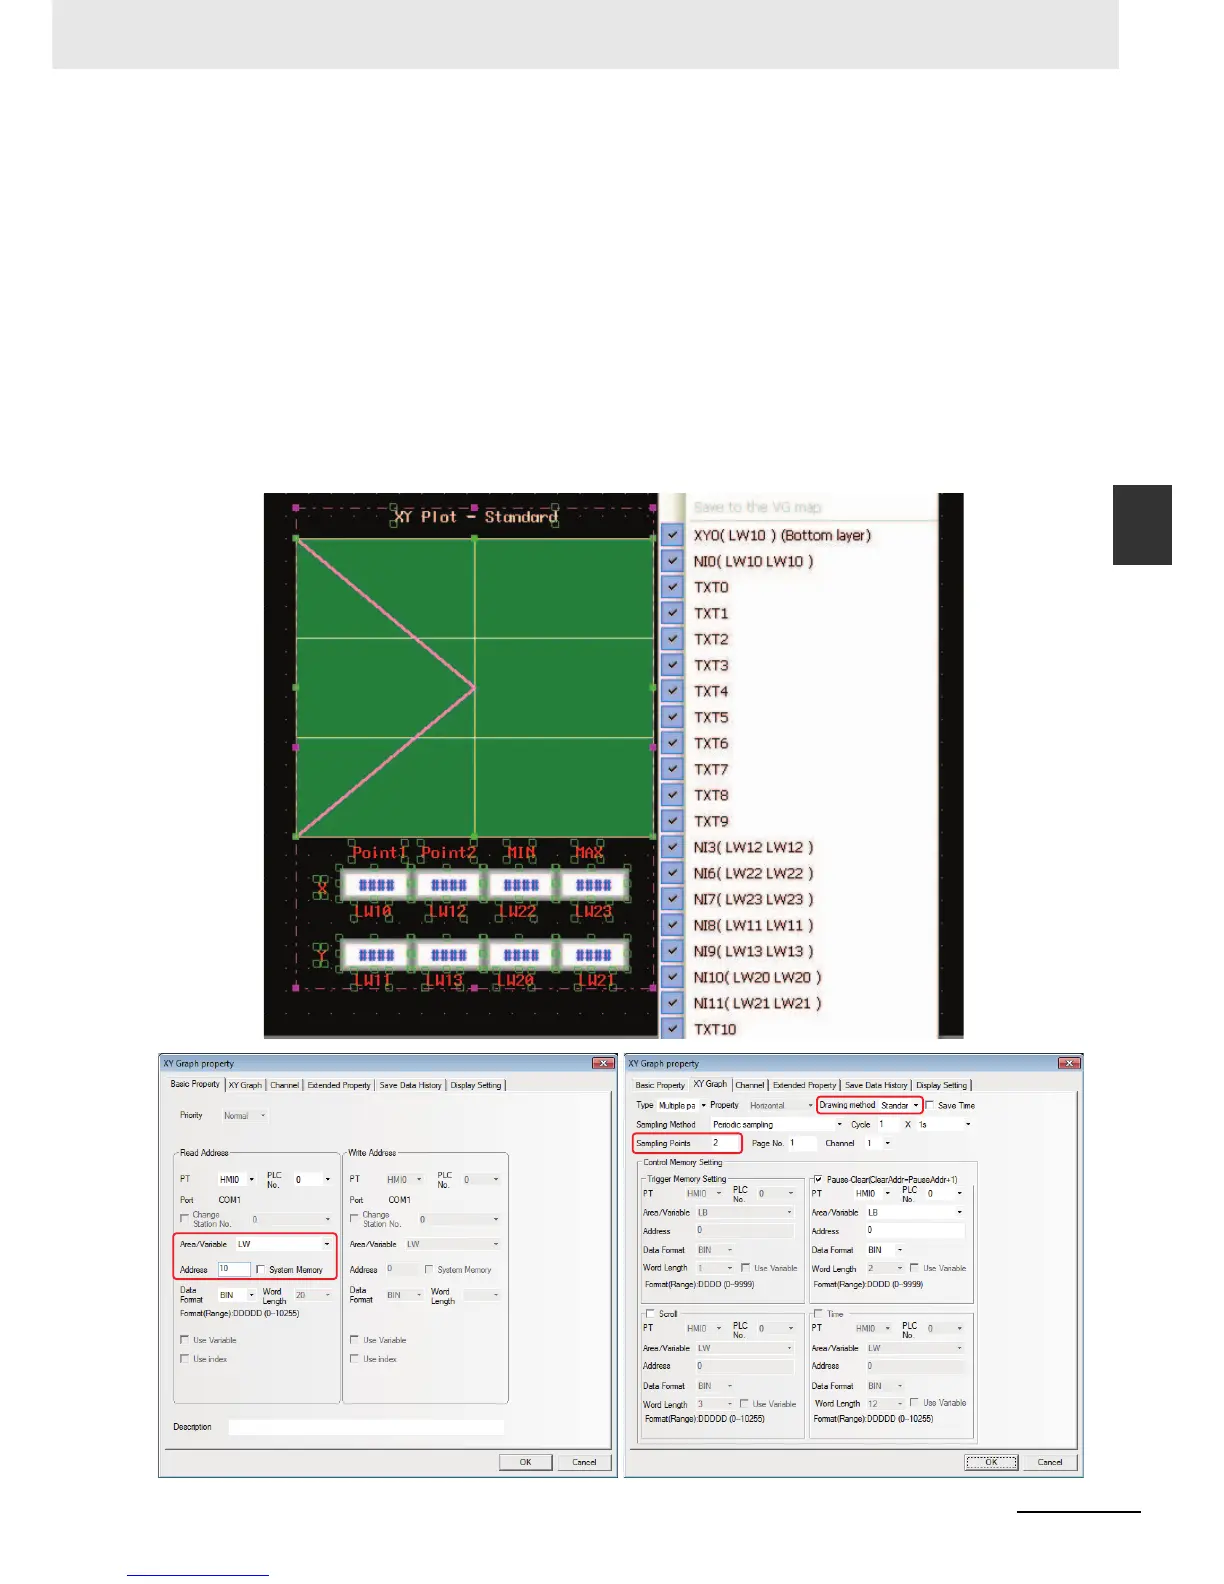
Press the [OK] button to complete the setup of the XY Graph component.
Example: When the maximum value and minimum value of a line graph (Drawing method:
Standard) are specified indirectly.
Descriptions: The coordinate position of sampling point 1 and sampling point 2 correspond to
“x, y (LW10, LW11)” and “x, y (LW12, LW13)”; and the minimum values and
maximum values of y coordinate and x coordinate are LW20 & LW21 and LW22
& LW23 respectively.

 Loading...