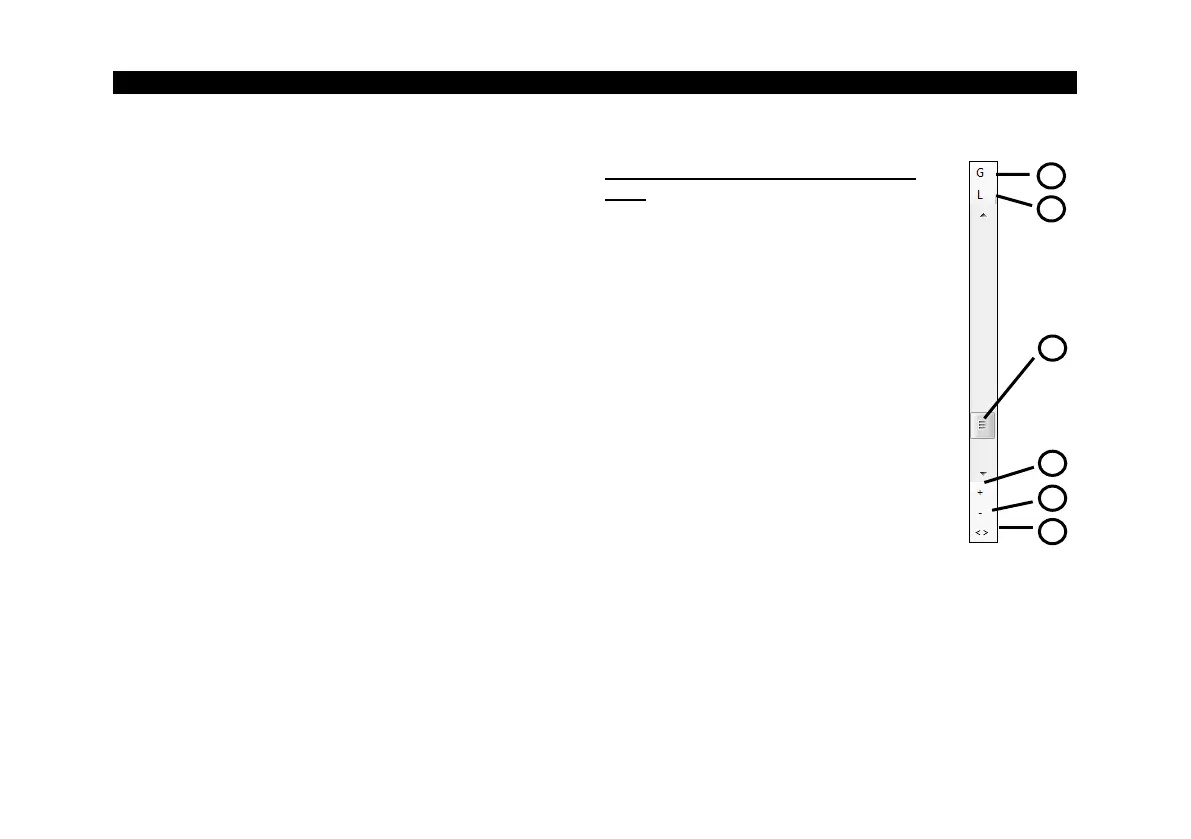
With global scaling the temperature range of the
diagram will automatically be adapted to the
respective peak values. The range will remain as
set during the whole measurement.
With local scaling the temperature range of the
diagram will be adapted dynamically to the
respective peak values. After the respective peak
has left the diagram in the further process of the
measurement, the range will be readapted. This
option enables an optimum display of the
temperature graph.
A manual scaling can be done at any time using
the control elements of the temperature axis.