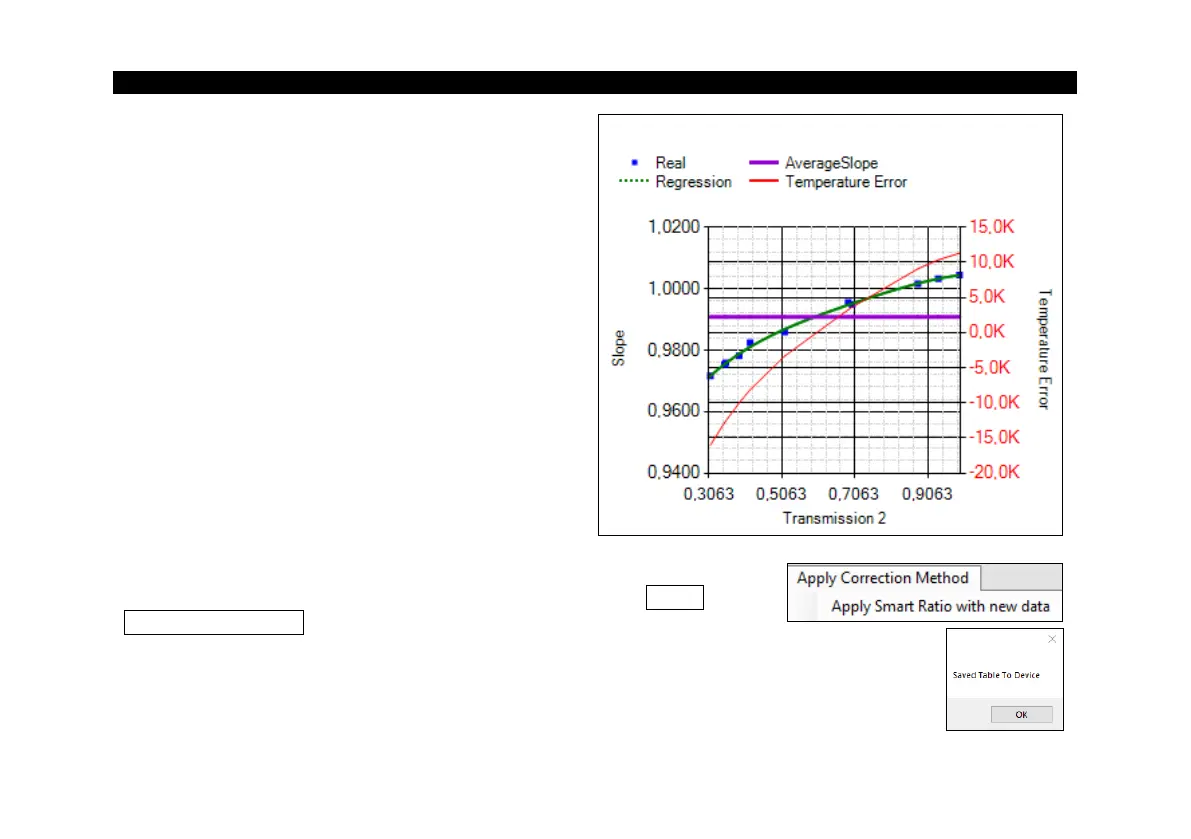
The right figure in the Smart Ratio Measurement
shows the transmission ratio (slope) relative to the
transmission of diode 2.
The blue points are the recorded measuring points.
The violet horizontal line is the average slope
calculated from the measured values.
The red curve is an estimate of the quotient
temperature error (in Kelvin) when using the
average slope without the Smart Ratio method.
Green curve: Regression curve (polynomial) for
calculating the values between the measurement
points.
To write the created curves to the device, the Apply Smart Ratio
with new data option must be selected in the menu under Apply
Correction Method. The created regression curve is now written
to the device. A message window appears indicating that the table
is being saved to the device. The Smart Ratio mode is now
automatically activated.