optris LS – E2006-01-A
28
Any activation of a control element of the time axis will stop the further actualization of the measurement graph.
The measurement itself continues in the background. To return to the current measurement graph please press
the Pause button [Menu: Measurement\ Pause] or C.
During the stopped status any parts of the diagram can be selected with the Time scroll bar. With the zoom in-
button + these parts can be stretched (enlarged) and with the zoom out-button – clinched (minimized).
S
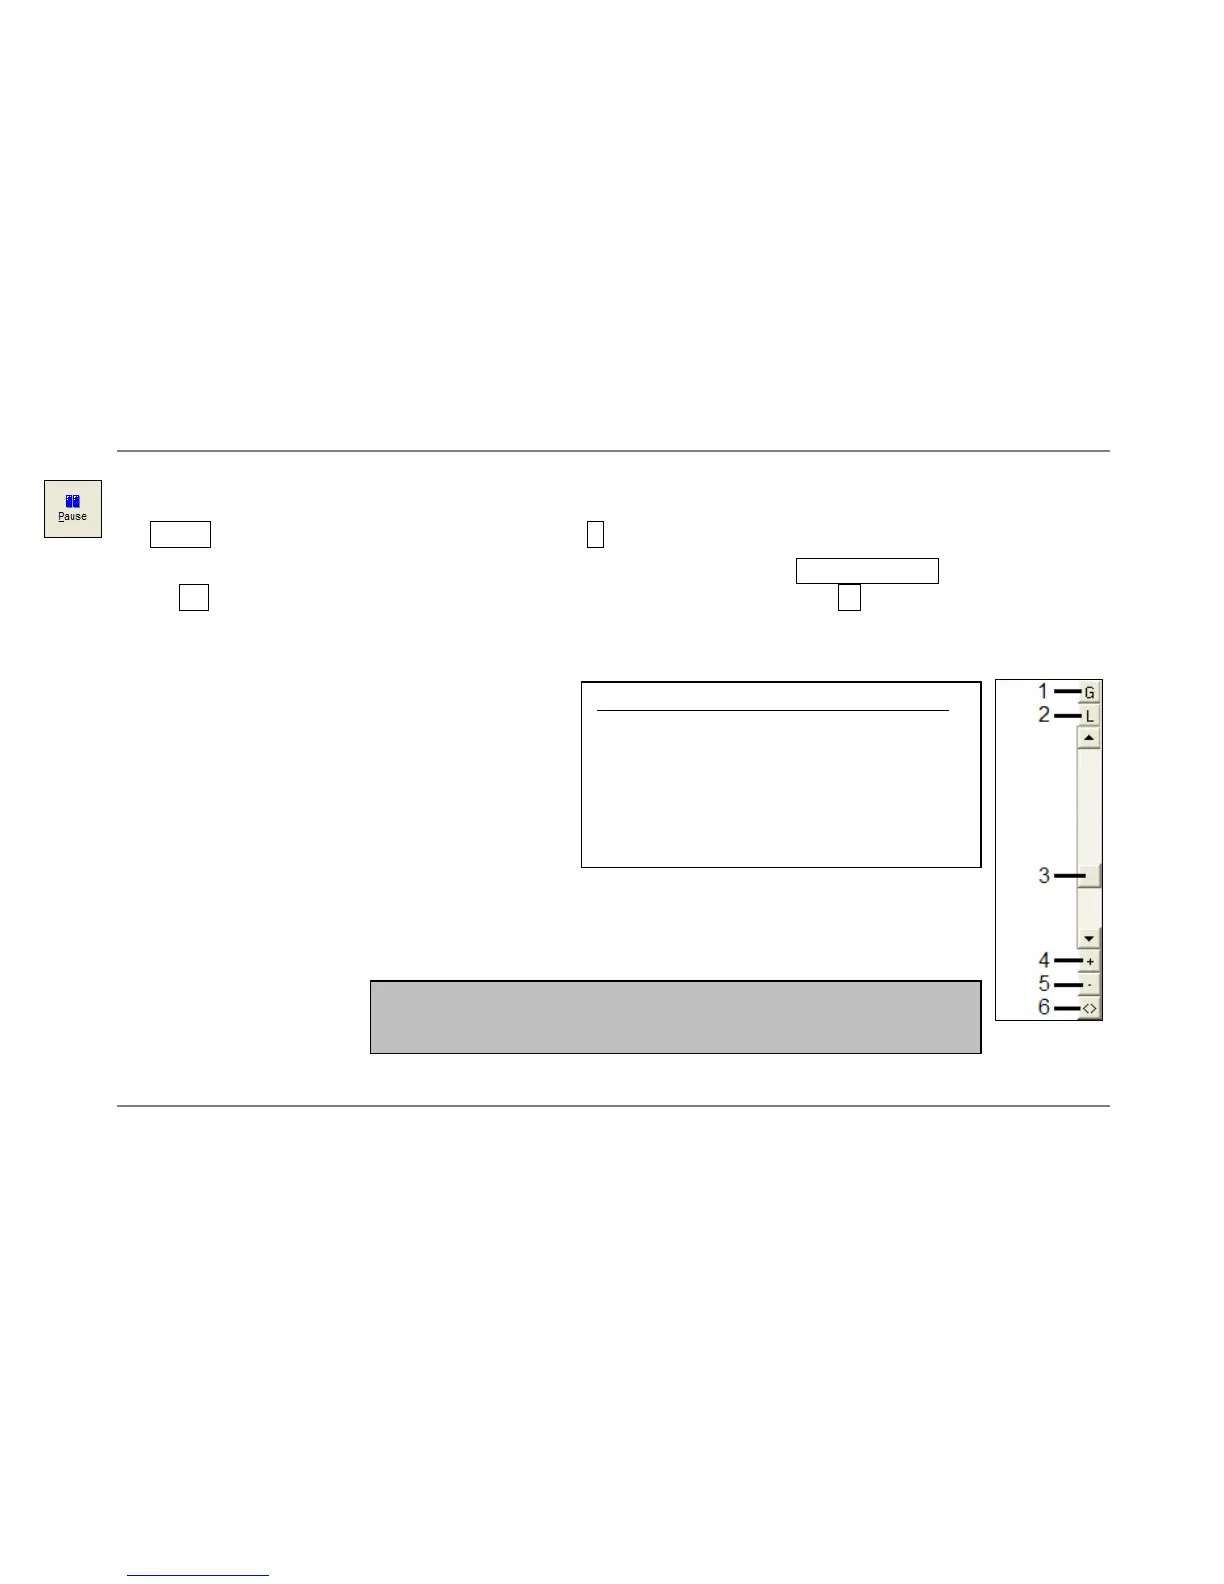
CALING OF THE TEMPERATURE AXIS
With global scaling the temperature range of the
diagram will automatically be adapted to the
respective peak values. The range will remain as
set during the whole measurement.
Control elements of the temperature axis:
1 Global auto scaling
2 Local auto scaling
3 Scroll bar
4 Zoom in (increase)
5 Zoom out (decrease)
6 Whole range
With local scaling the temperature range of the
diagram will be adapted dynamically to the
respective peak values. After the respective peak
has left the diagram in the further process of the
measurement, the range will be readapted. This option enables an optimum display of the
temperature graph.
A manual scaling can be done at any time using the control elements of the temperature axis.