CHAPTER 6
120 PerkinElmer Life and Analytical Sciences
AB Curve
Click this button to display the stored Alpha Beta Standard misclassification
(spillover) curve for the Standard Set selected in the table.
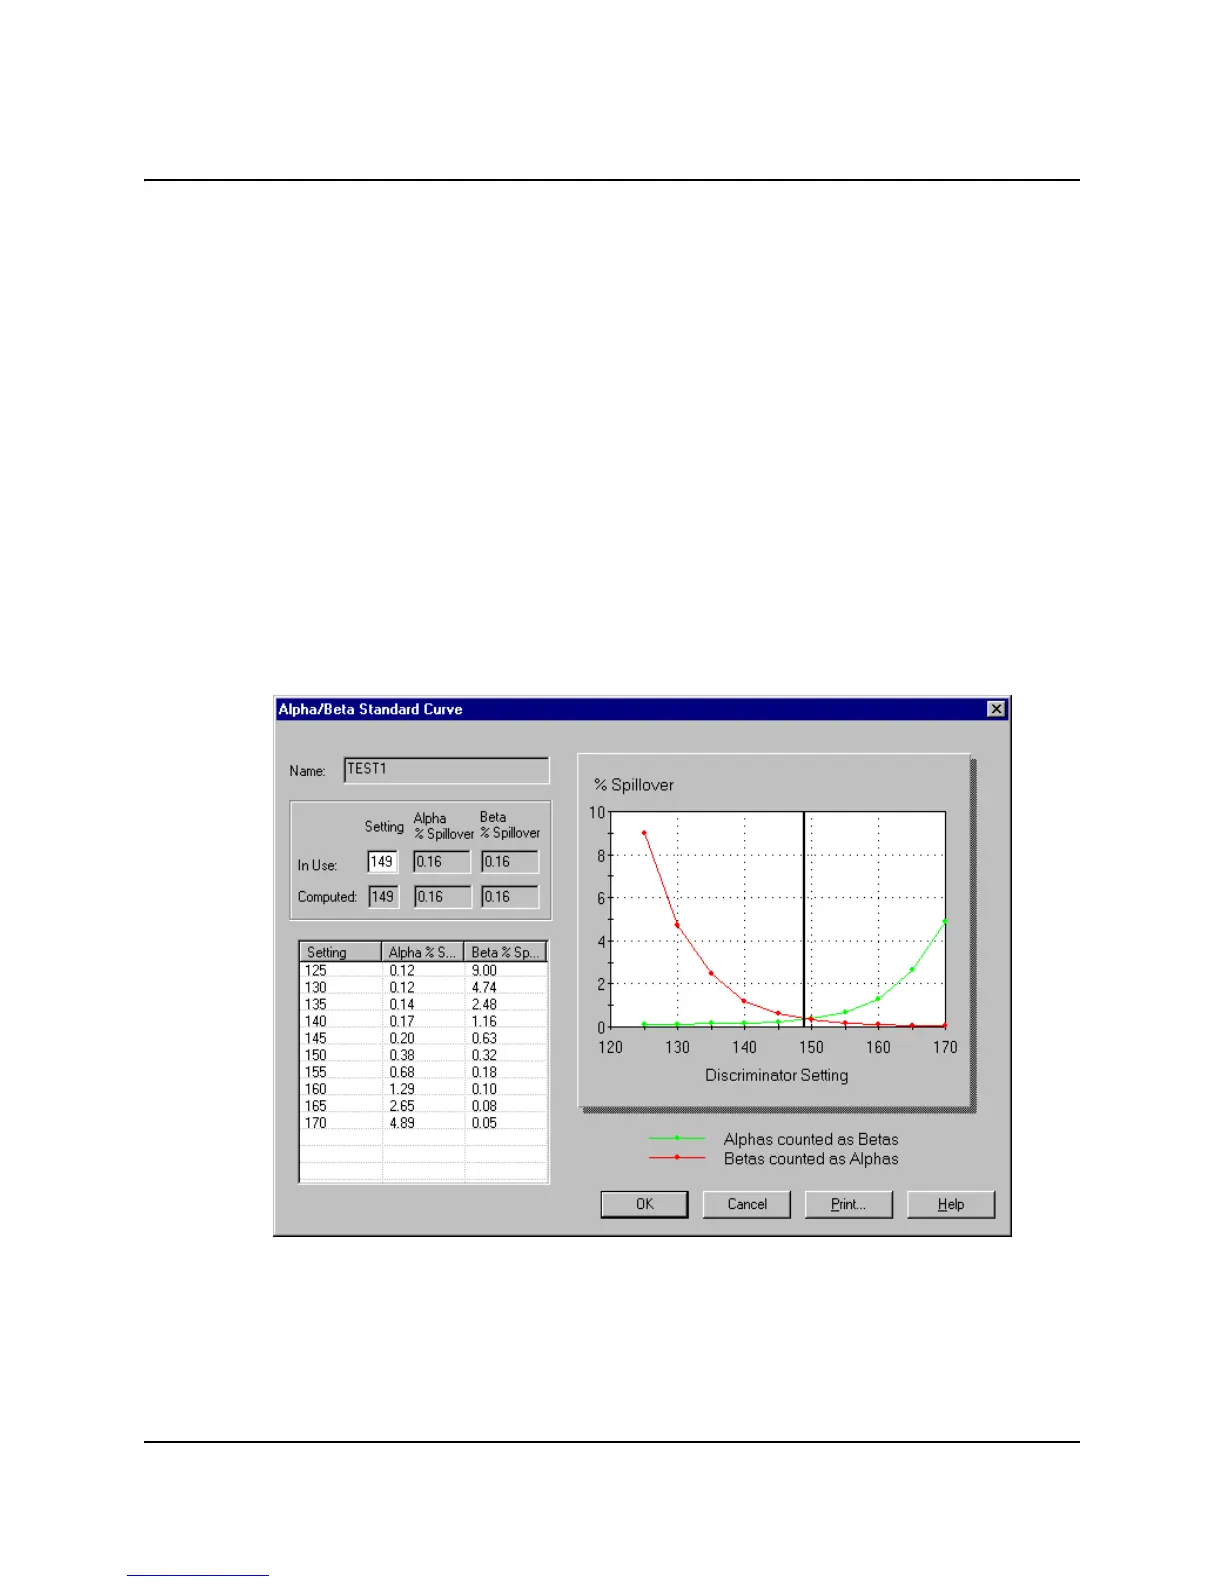
The Alpha/Beta Standard Curve window shows the data used to calculate the
optimal discriminator setting for the Standard Set. This data is generated from
counting an Alpha Beta Standards assay. The data points for the curve are shown
in a table and are also plotted graphically.
The calculated optimum discriminator setting appears as the Computed value in
this window. If you want to further minimize misclassified events for one of the
nuclides, you can enter your own discriminator setting for the In Use value
instead of using the optimum setting determined by the instrument. Higher values
will favor alpha counting and lower values will favor beta counting.
Spillover percentages are shown for both the Computed and In Use values. The In
Use setting is reported and used as the Discriminator Setting in the Alpha Beta
Standards Library.
Figure 6-4 Alpha Beta Standard Curve Window.
 Loading...