CHAPTER 4
64 PerkinElmer Life and Analytical Sciences
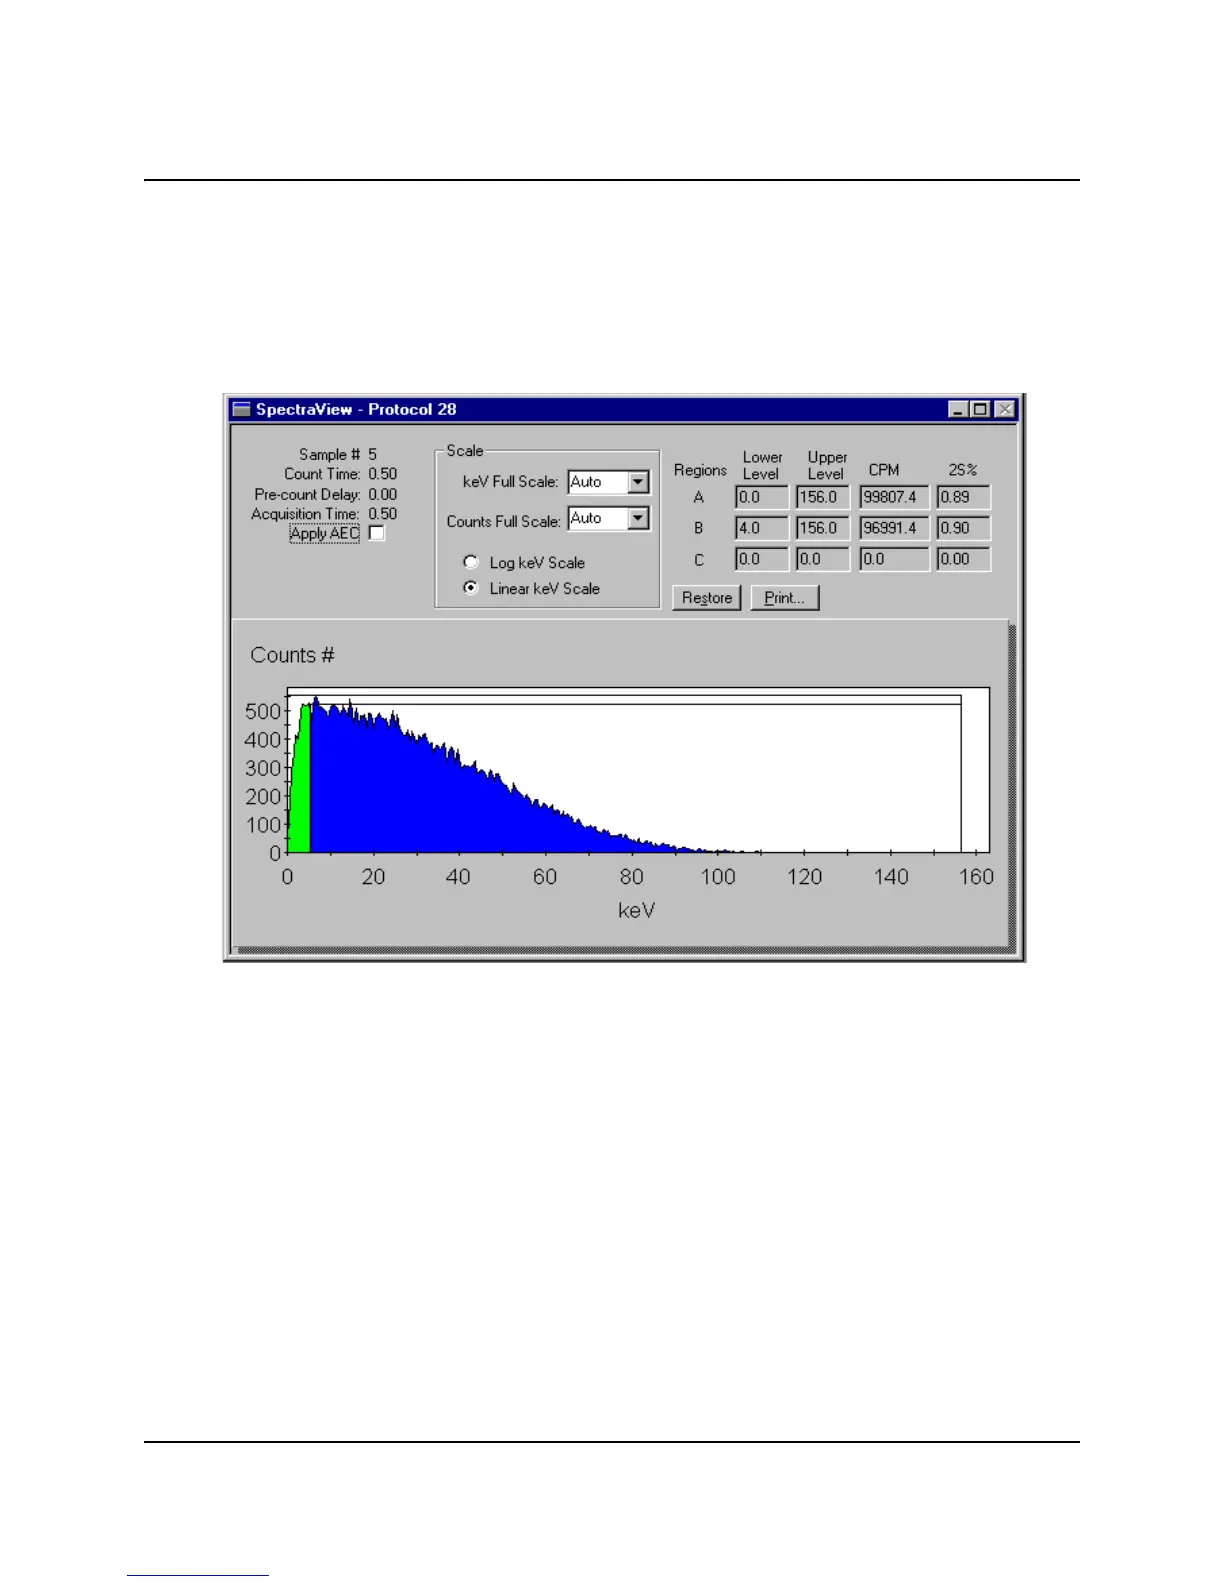
The SpectraView Window
The SpectraView window is part of the main window. It displays a two-
dimensional, real-time view of the spectrum for the current sample. It provides
you with information about the status of a sample count and the region settings
used in the counting procedure. A number of display options are available for the
spectrum and are defined in this window.
Figure 4-41 The SpectraView Window.
The SpectraView window is typically used for the following:
Monitoring sample counting.
Detecting spectral distortions or compressions resulting from sample quench.
Observing the effect of altering the counting region settings.
Viewing the spectrum in linear or logarithmic scale.
The X-axis of the spectral display represents the energy (in keV) for each counting
channel up to the defined endpoint of the sample spectrum. The Y-axis represents
the gross counts for the current sample. The regions settings are graphically
displayed using solid line boxes. This window is updated every six seconds.
 Loading...