THE SYSTEM SOFTWARE
PerkinElmer Life and Analytical Sciences 63
A sample with a quench level exceeding the limits of the quench standards will
have its position on the map determined by extrapolation. The lower limit of
extrapolation is the tSIE plus 10% of the least quenched standard; the upper limit
of extrapolation is the tSIE minus 10% of the most quenched standard.
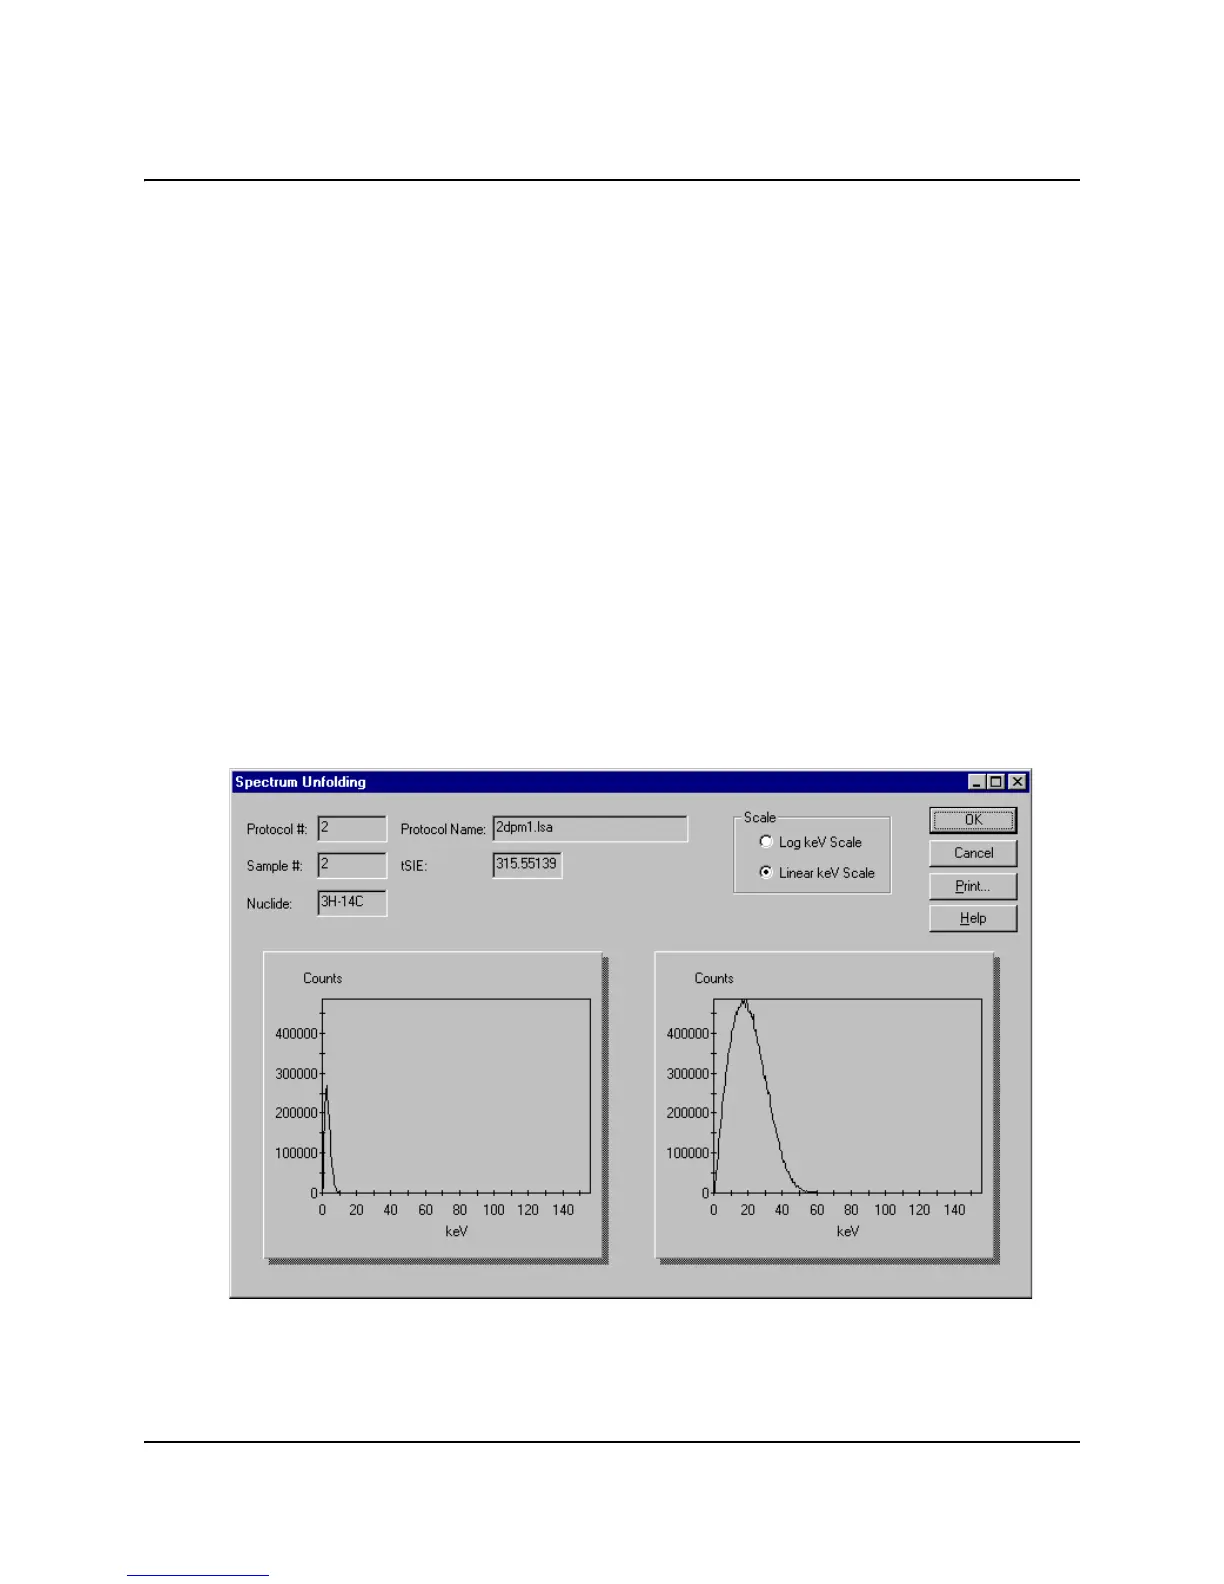
Spectrum Unfolding
During a Dual-label DPM or Full Spectrum DPM sample count, the Spectrum
Unfolding window can display three dimensionally, the composite nuclide
spectrum as individual, separate spectra for each nuclide. The X-axes of the
spectral displays represent the energy (in keV) for each counting channel up to
the defined endpoint of the sample spectrum. The Y-axes represents the gross
counts for the current sample. Spectrum Unfolding is often useful for the
following:
Visualizing the relationship of the individual nuclide spectra.
Approximating the ratio of lower energy nuclide to higher energy nuclide.
Display the unfolded spectra by selecting the Tools-Spectrum Unfolding menu
option.
Figure 4-40 Spectrum Unfolding Window.
 Loading...