CALIBRATION AND NORMALIZATION
PerkinElmer Life and Analytical Sciences 127
IPA Charts & Tables (optional on TriCarb 2800 and 2900TR)
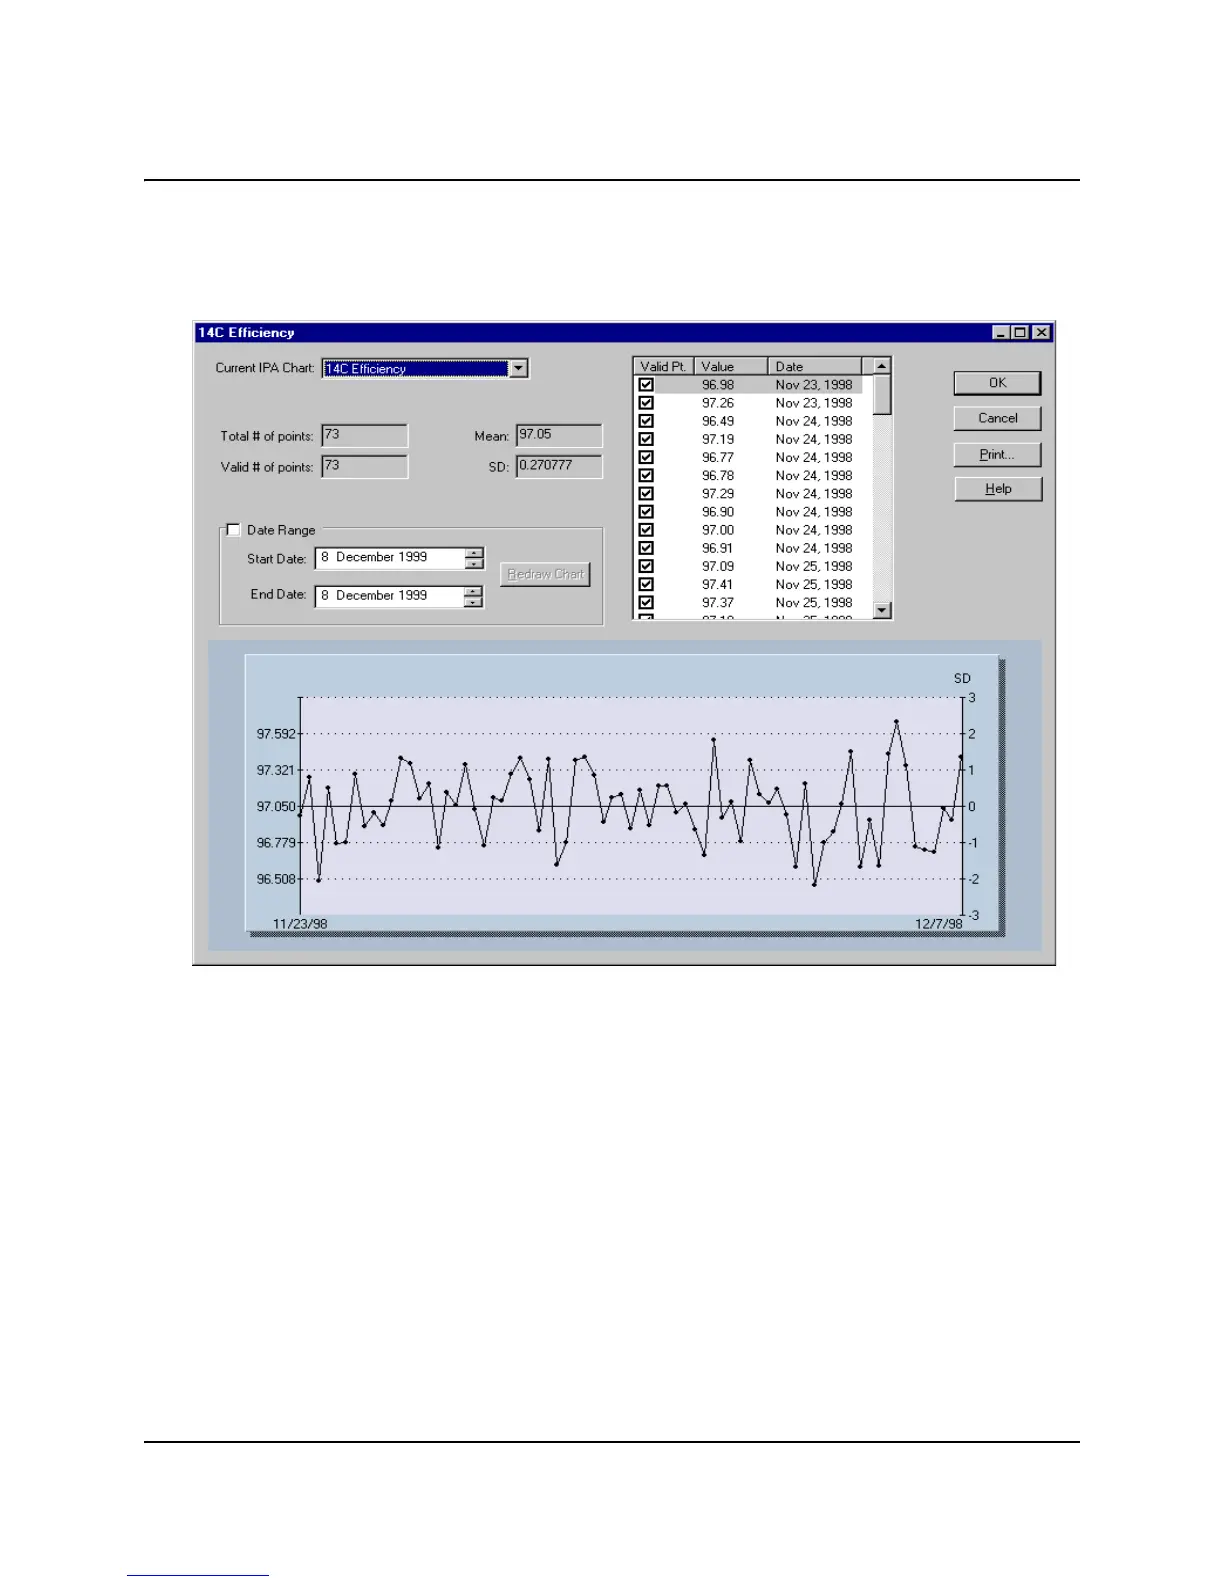
The following window displays a typical IPA chart and table for Carbon-14
Efficiency:
Figure 7-2 IPA Charts & Tables Window
The IPA Charts & Tables window allows you to view, edit and print data for
individual IPA parameters in chart or tabular form. When the data is displayed as
a table, points can be included or excluded from the data set. The axes on the
chart represent the Mean and Standard Deviation values for the selected IPA
parameter. Using the Print button, you may print an individual IPA chart or table,
or you may print all the IPA charts and tables.
All of the available IPA charts have similar graphical displays and include the same
data items.
 Loading...