CHAPTER 4
38 PerkinElmer Life and Analytical Sciences
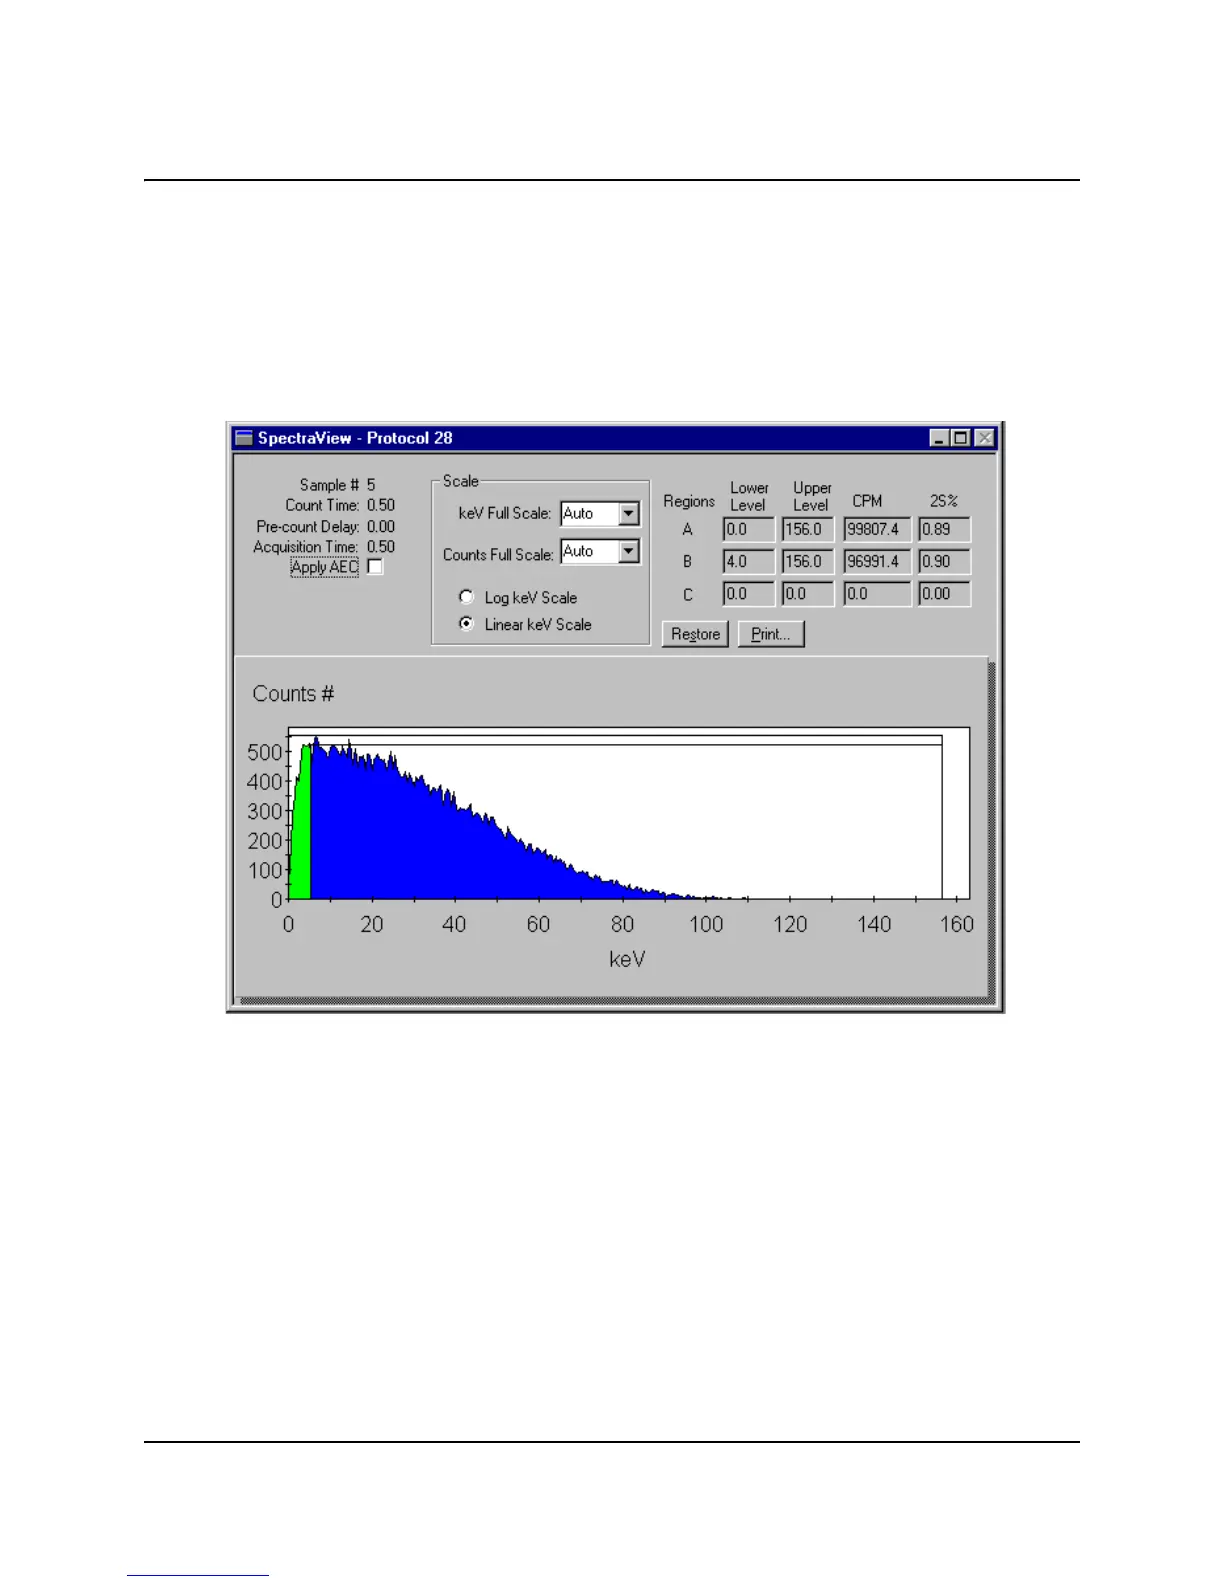
The SpectraView Window
The SpectraView window is part of the main window. It displays a two-
dimensional, real-time view of the spectrum for the current sample. The spectrum
is updated every six seconds and can be displayed using either linear or
logarithmic axes. It provides you with information about the status of a sample
count and the region settings used in the counting procedure. A number of
display options are available for the spectrum and are defined in this window.
Figure 4-3 SpectraView Window
The SpectraView window is typically used for the following:
1. Monitoring sample counting.
2. Detecting spectral distortions or compressions resulting from sample quench.
3. Observing the effect of altering the counting region settings.
4. Viewing the spectrum in linear or logarithmic scale.
 Loading...