CHAPTER 4
62 PerkinElmer Life and Analytical Sciences
Spectral Displays
Spectral Mapping
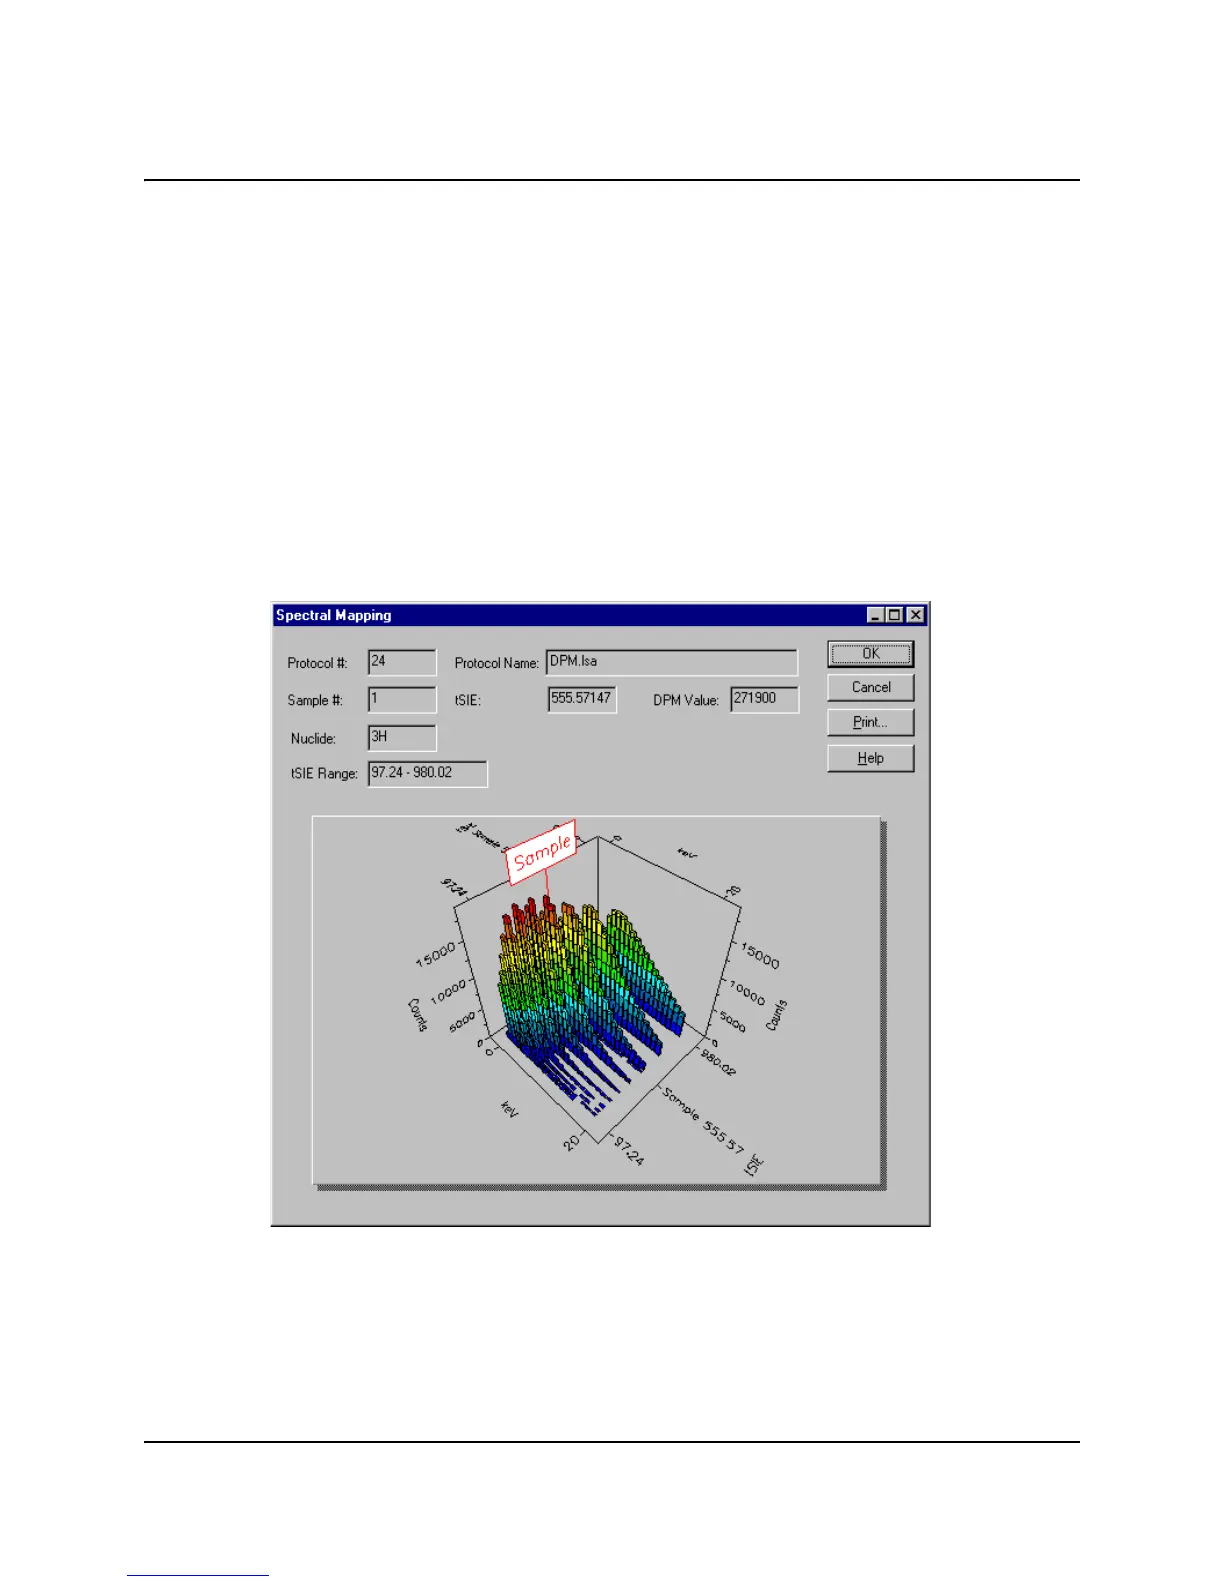
During a single-label DPM sample count, the Spectral Mapping window can display
the sample and quench standards spectra in a three-dimensional view. The X-axis
of the map represents the energy in keV, the Y-axis represents the counts and the
Z-axis represents the quench indicating parameter, tSIE. The spectral map can be
used for the following:
Comparing a sample spectrum to the quench standard spectrum.
Checking for spectral anomalies.
Display a spectral map by selecting the Tools-Spectral Mapping menu option.
Figure 4-39 Spectral Mapping Window
 Loading...