57
2. Main Screens (Touchscreen)
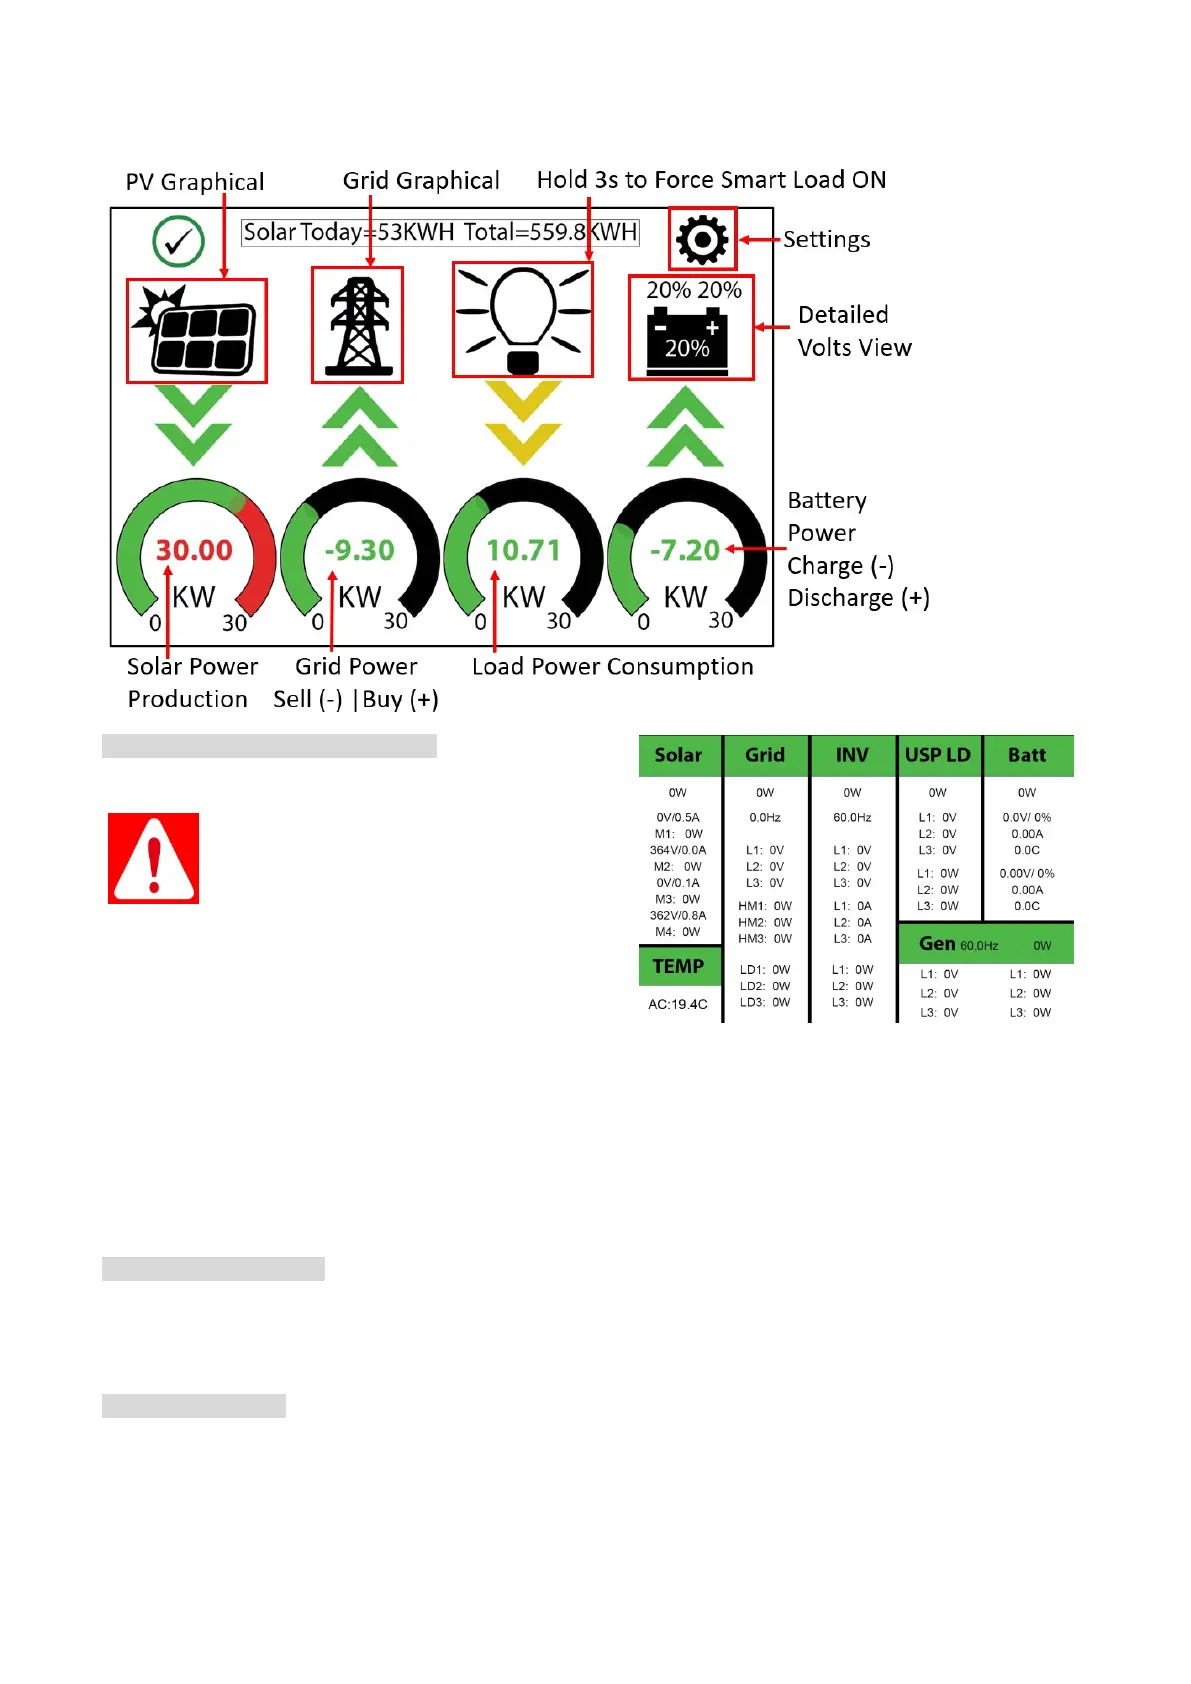
Detailed Volts View (Press Batt Icon)
• Top row = Total power for the column
• Solar Column: Displays voltage and amps per MPPT
Danger: PV Voltage not to exceed 500V.
Danger: Des dommages se produiront si PV
COV > 500 V.
• Grid Column
o If selling to the Grid, Grid Watts = negative
o If buying from the Grid, Grid Watts = positive
o HM = power detected by the external current sensors
on the entire home L1 / L2 / L3
o LD = power detected using internal sensors
• INV Column: Voltage, Amps, and Watts for L1, L2, L3
• UPS LD Column: Load Voltage and Watts for L1, L2, L3
• Batt Column: Voltage/Percentage, Amps, and Temp for Batt 1 and Batt 2
• GEN Column: Generator or AC Coupled Input Volts and watts for L1, L2, L3
• AC Temp = Temperature of AC conversion electronics
o Batt → AC
o PV → AC
PV Solar Graphical View
A. Displays power production over time for the PV array.
B. Use up/down buttons to navigate between days.
C. Month view, Year view, and Total view
NOTE: Reversed Grid Watt values may indicate incorrectly installed current sensors (reversed polarity).
Grid Graphical View
A. Displays power drawn from and sold to the grid over time.
B. Bars above the line indicate power bought from the grid.
C. Bars below the line indicate power sold back to the grid.
D. Line Frequency: useful when using off-grid when the generator is connected to grid input to verify the
generator output frequency.
This view can help determine when the peak power is used in the Home and for Time of Use programming.