29
ADT and ADT View user guide
ADTi-100
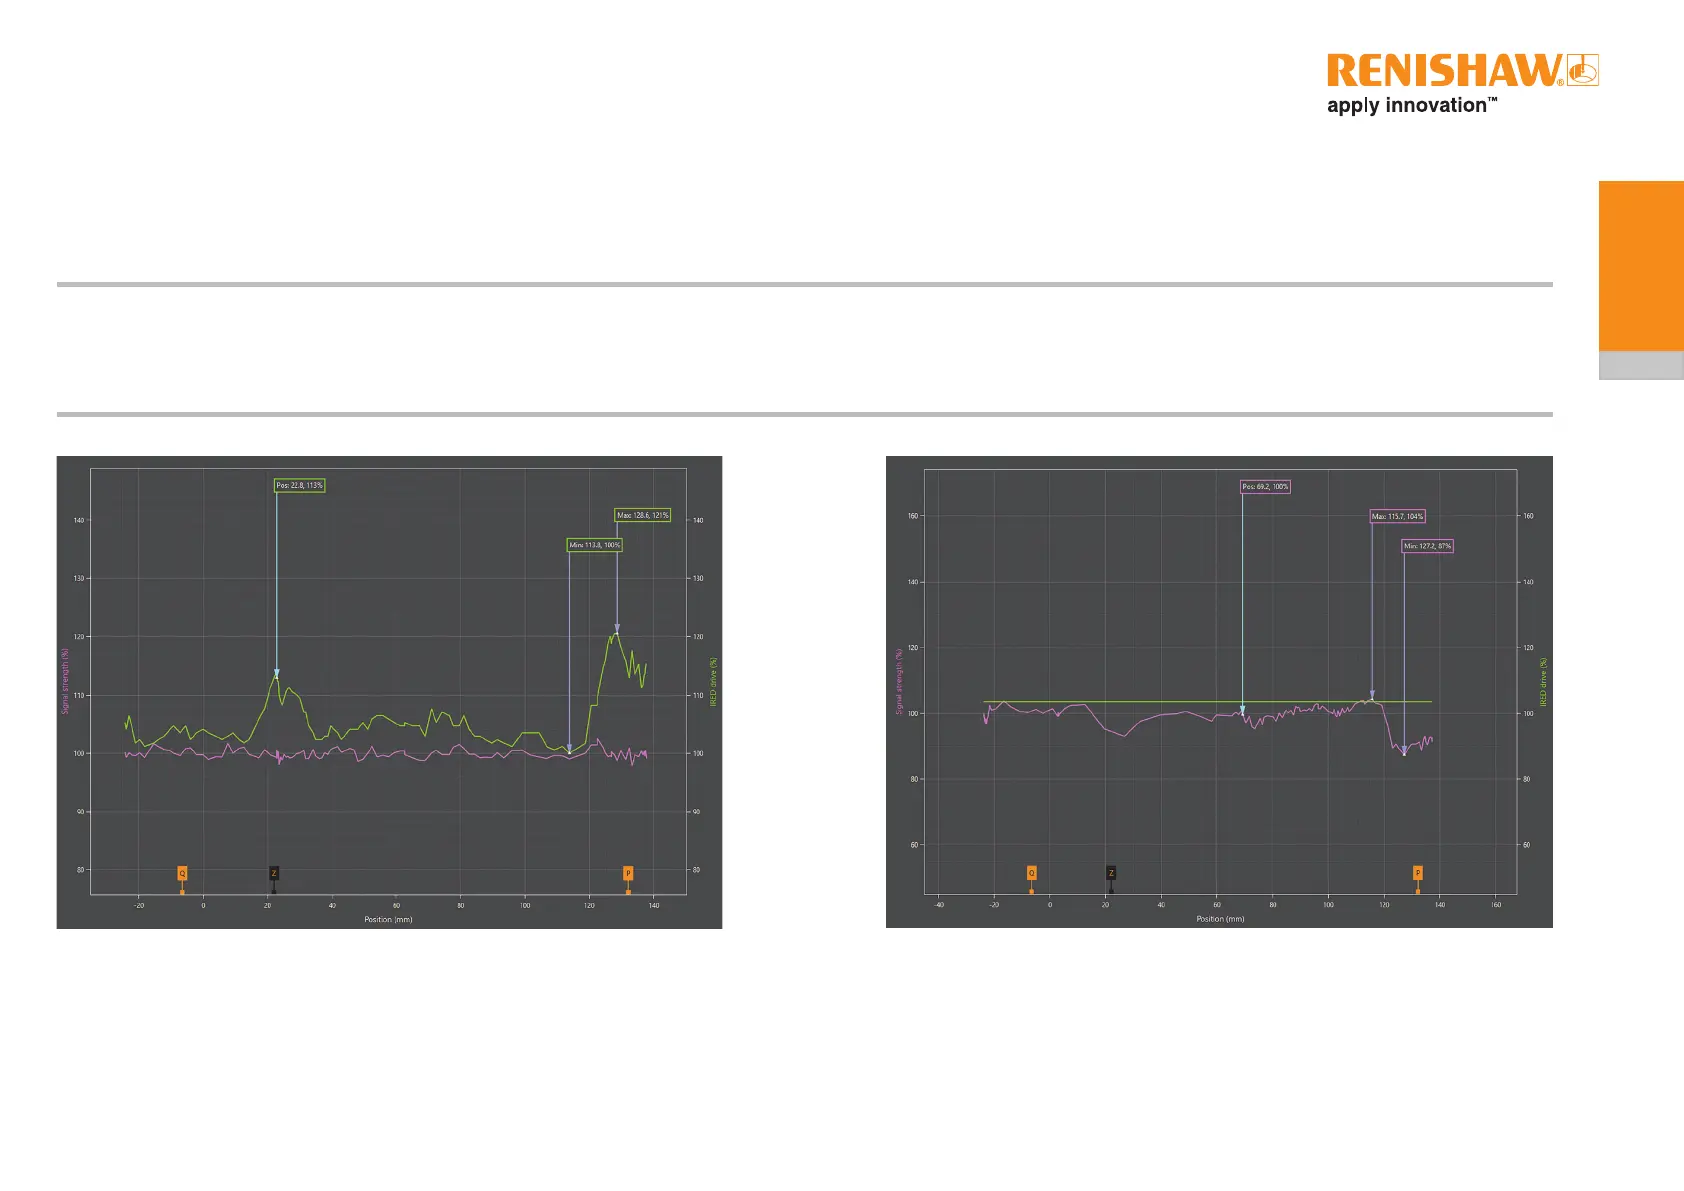
6.3.1 Signal strength and IRED drive plots
Thegraphdisplays2plotswhichautomaticallyrescaleasthereadheadismovedalongtheaxis:
• Signal strength vs position (purple plot)
• IRED drive vs position (green plot). The IRED drive is the relative current through the infrared emitter (IRED) in the readhead.
The limit and reference mark positions are displayed along the bottom where applicable.
NOTES:
• Maximumspeedoftravelforausefulsignalstrengthvspositionplotis1m/s.
• During installation mode changing direction of the readhead at speed may result in multiple reference marks or limits being plotted on the graph; this is due to the speed of movement being faster
than the data plot rate.
• If an alarm or warning occurs the plot will automatically stop. Click the green triangle or press the space bar to restart the plot (section 6.3.2.2).
AGC enabled AGC disabled
When Auto Gain Control (AGC) is enabled (default):
• ThemaximumandminimumIREDdriveandIREDdriveatthecurrentpositionare
shown in greenboxes.
• For a good set-up the IRED drive will vary along the plot whilst the signal strength
plotshouldremainconstantatapproximately100%.
When AGC is disabled:
• Themaximumandminimumsignalsizeandsignalsizeatthecurrentpositionare
shown in purpleboxes.
• The signal strength will vary along the plot whilst the IRED drive plot remains constant.
 Loading...