32
ADT and ADT View user guide
ADTi-100
6.4.1 Graph controls
6.4.1.1 Starting/stopping a plot
Click the green arrow or press space bar to start a plot; the plot will automatically rescale
asthereadheadismovedalong/aroundtheaxis.Thearrowwillchangetoaredsquare
whilst data is being recorded. To stop the plot, click on the red square.
NOTE: Changing screens will clear the data and a new plot will restart automatically when the velocity
screen is reselected.
6.4.1.2 Zooming and panning the plot
Theplotcanbezoomedandpannedusingamouse,trackpad,touchscreenorsimilar.
To pan using a mouse:
• Point the mouse at the trace, click and hold the right mouse button and drag the trace left,
right, up or down.
Tozoomusingamouse/trackpad:
• Clickwiththeleftmousebuttonthendragthemousetodrawaboxaroundthesectionof
interest
Or
• Movethemousewheeltozoomthewholeplotinorout.
Tozoomandpanusingatouchscreendevice:
• Panbyswipingngeralongthescreeninthedirectionyouwanttomovetheplot.
• Zoomusingathumbandnger.Movethemawayfromeachothertozoominand‘pinch’them
togethertozoomout.
NOTES:
• Whenzoomingorpanningduringa‘live’plotthedatawillcontinuetobeplottedbutonlythe
selected area will be displayed and the plot will no longer scroll. To display the whole plot,
select‘Resetplotmagnication’.
• Stoppingtheplotwillautomaticallyresetthemagnicationanddisplaythecompleteplot.
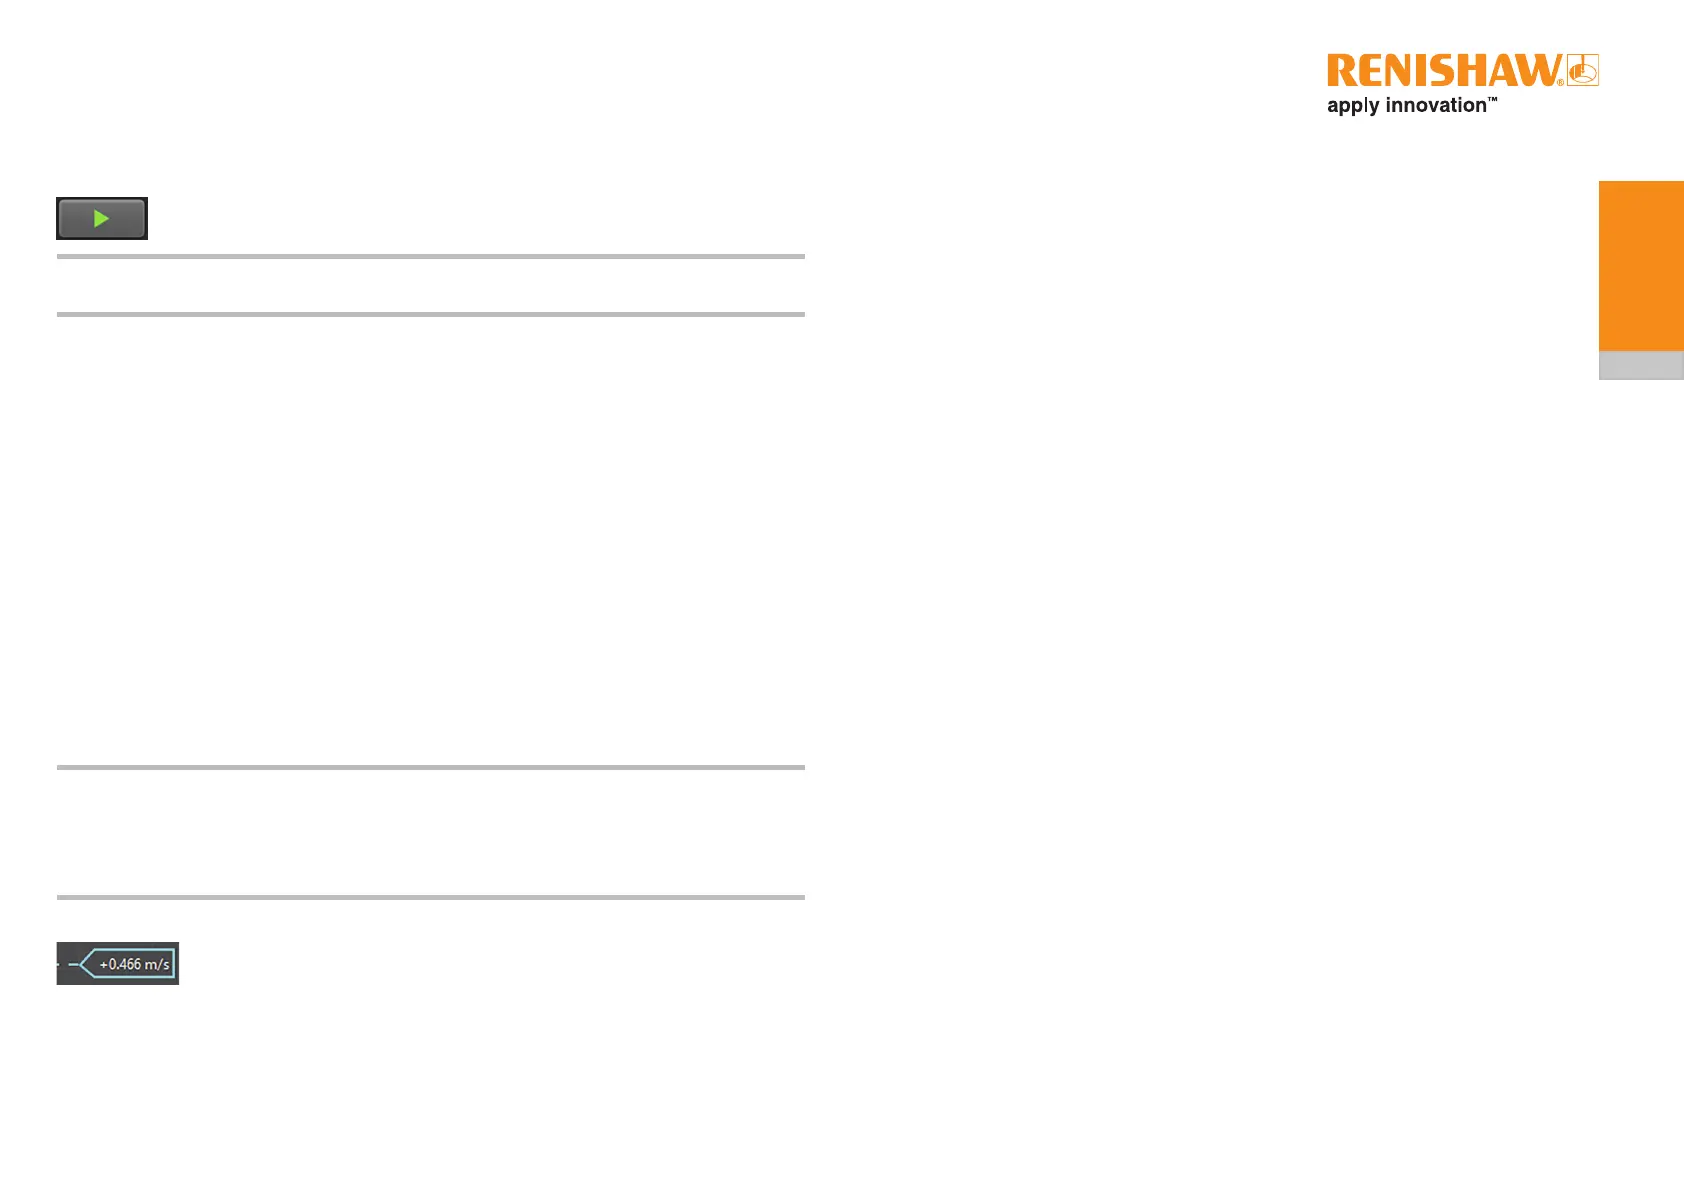
6.4.1.3 Moving the cursors
Click the cursors with the left mouse button and drag them to the chosen position to
measure the velocity.
 Loading...