19
ADT and ADT View user guide
ADTa-100
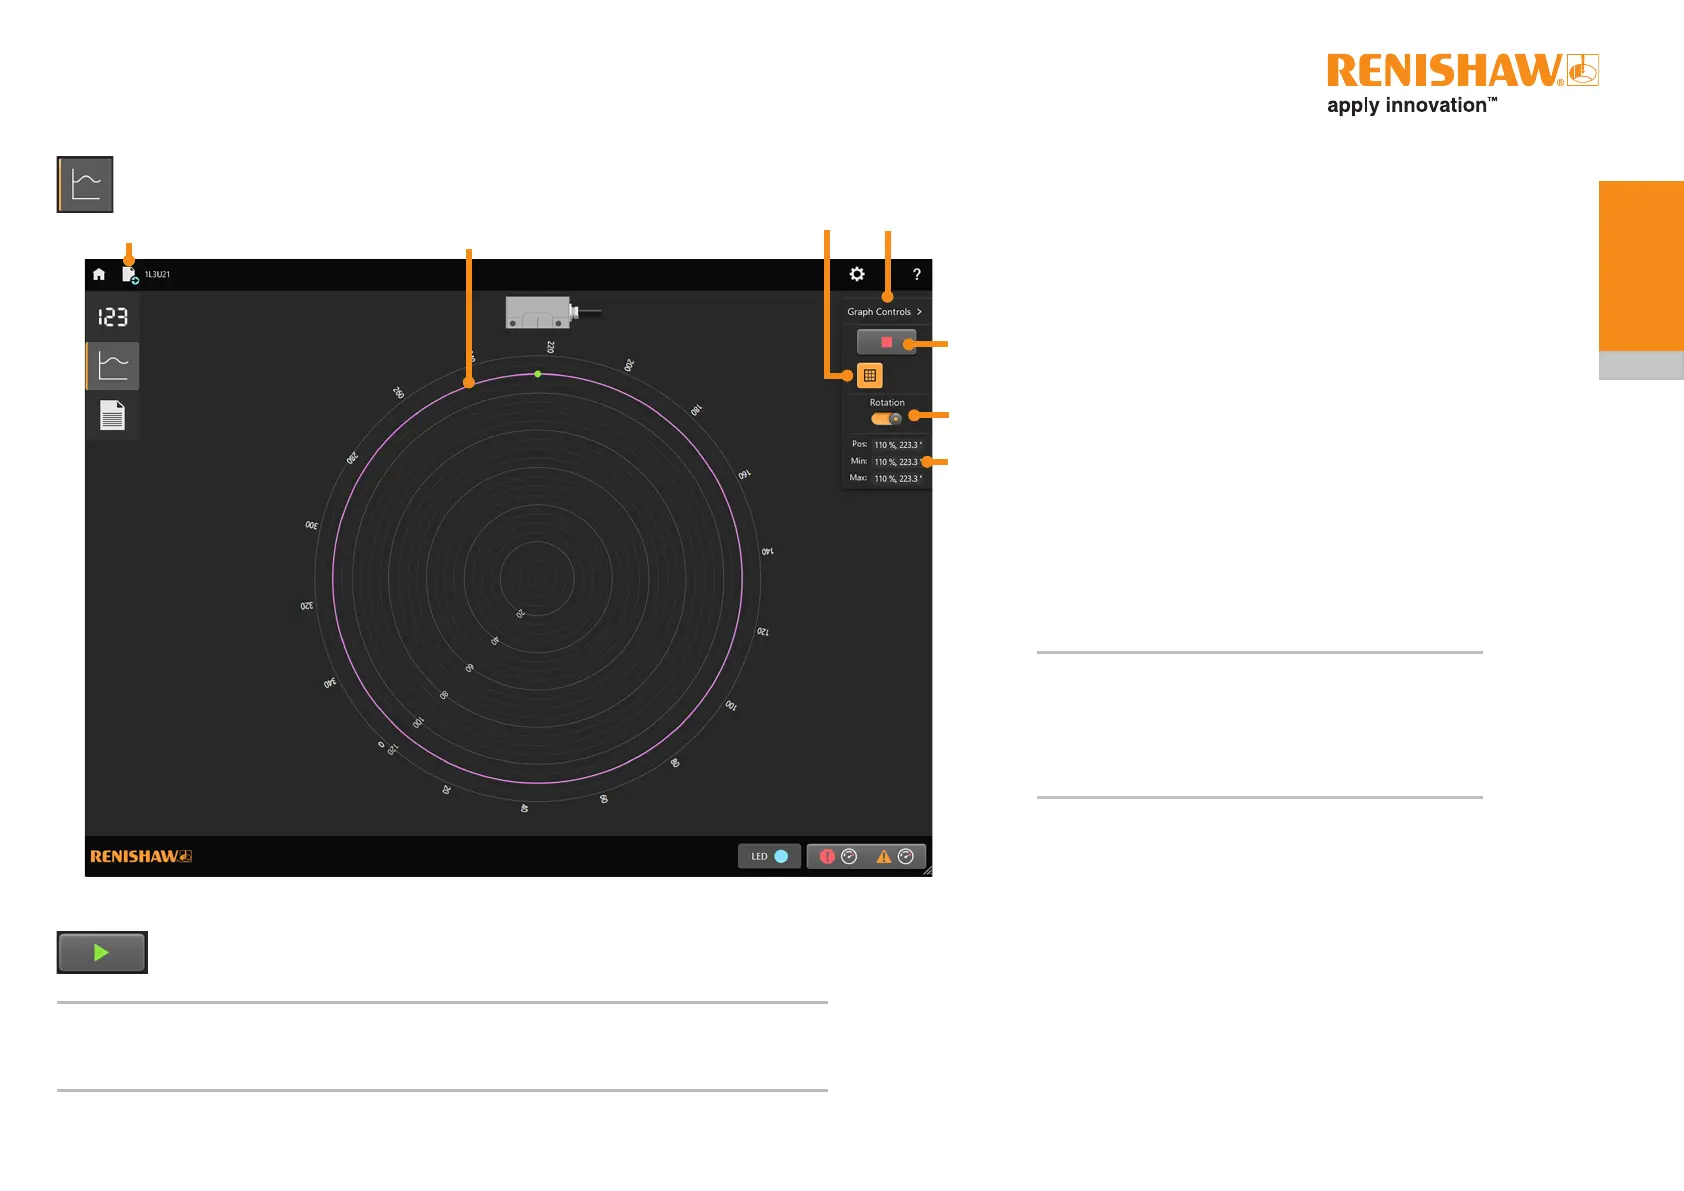
5.2.2 Rotary systems
Thesignalvspositionscreenplotsthesignalsizearoundarotaryaxis.
1 Save data
2 Plot of signal strength vs position
3 Enable/disable plot grid lines
4 Select to show/hide Graph Controls
5 Start/stop a plot (section 5.2.2.1)
6 If ‘Rotation’ is selected, the graph rotates, allowing the
position detection point to always remain on the top of the
graph. If ‘Rotation’ is deselected, the graph remains still
and the position point rotates around the graph.
7 Shows the current position and the signal strength, as well
asthemaximumandminimumsignalstrengthswiththeir
corresponding positions
When an alarm or warning occurs, a pop-up describing the
error condition will be displayed for 3 seconds. See section
5.1.4 for more information on alarms and warnings.
NOTE:Themaximumspeedthatthereadheadcantravelover
the ring to display a useful Signal Strength/Position plot
is0.5m/s.Thisisapproximatelyequivalentto50rpm
with a 200 mm diameter ring. Note that improved plot
resolution is possible at slower travelling speeds.
Also note that it is recommended to disable ‘Rotation’
when using the higher speeds with the rotary display.
5.2.2.1 Starting/stopping a plot
Click the green arrow to start a plot. The arrow will change to a red square whilst data is being
recorded. To stop a plot, click on the red square.
NOTES:
• When the readhead direction is reversed, the trace direction will reverse and previous data will be overwritten
• Changing screens during data plotting will clear the data and a new plot will restart automatically when the
signal strength vs position screen is reselected. Stop the plot before switching screens to retain the data.
1
2
4
5
6
3
7
 Loading...