31
ADT and ADT View user guide
ADTi-100
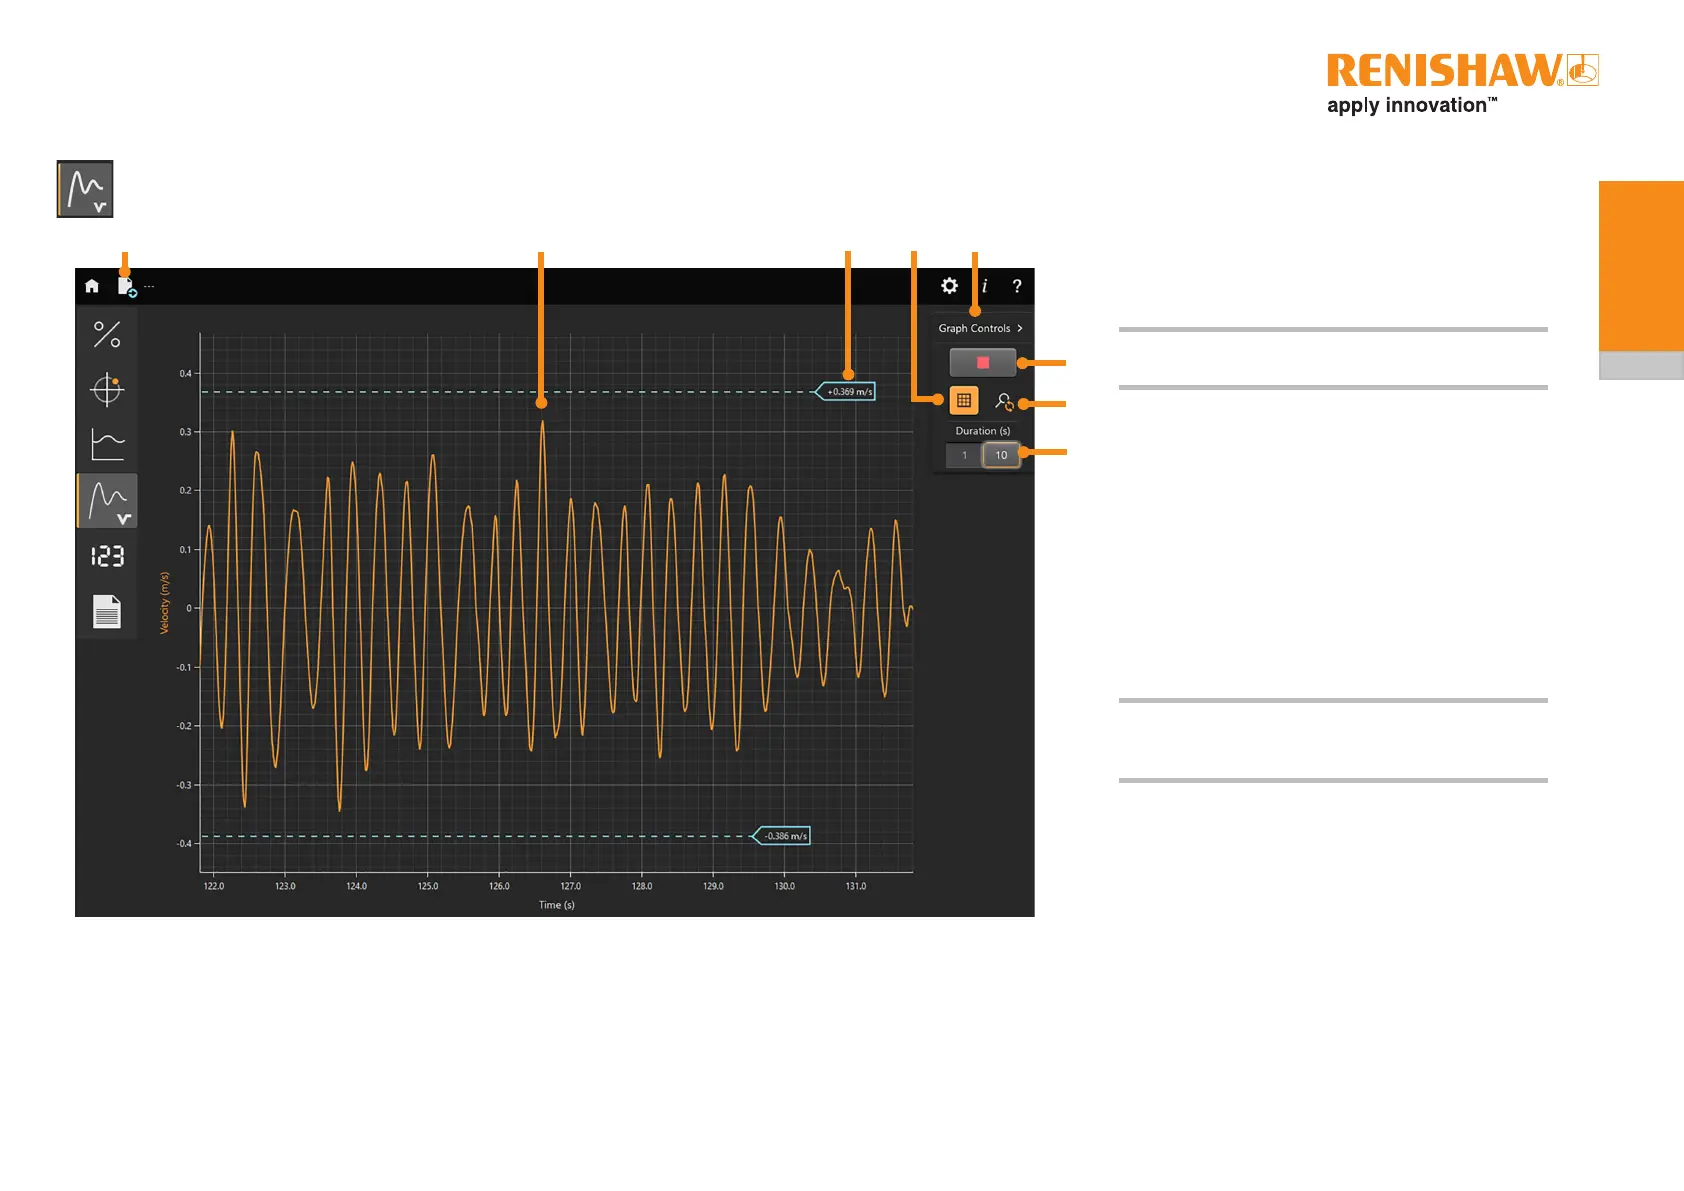
6.4 Velocity plot
The velocity screen plots the readhead velocity against time.
1 Save data
2 Plot of the readhead velocity against time
NOTE:Theplotcanbezoomedandpanned.
See section 6.4.1.2 for more information.
3 Cursors to measure peak velocity (section 6.4.1.3)
4 Enable/disable gridlines
5 Select to show/hide Graph Controls
6 Start/stop a plot (alternatively press the space bar)
(section 6.4.1.1)
7 Resetplotmagnication
8 SelecttheX-axisscaleandrateofdatasampling
When an alarm or warning occurs, a pop-up describing the
error condition will be displayed for 3 seconds. See section
6.1.6 for more information on alarms and warnings.
NOTE: The velocity plot is only valid at speeds up to
5 m/s. At faster speeds the speed of movements
may be faster than the data plot rate.
31 2
5
6
7
8
4
 Loading...