17
ADT and ADT View user guide
ADTa-100
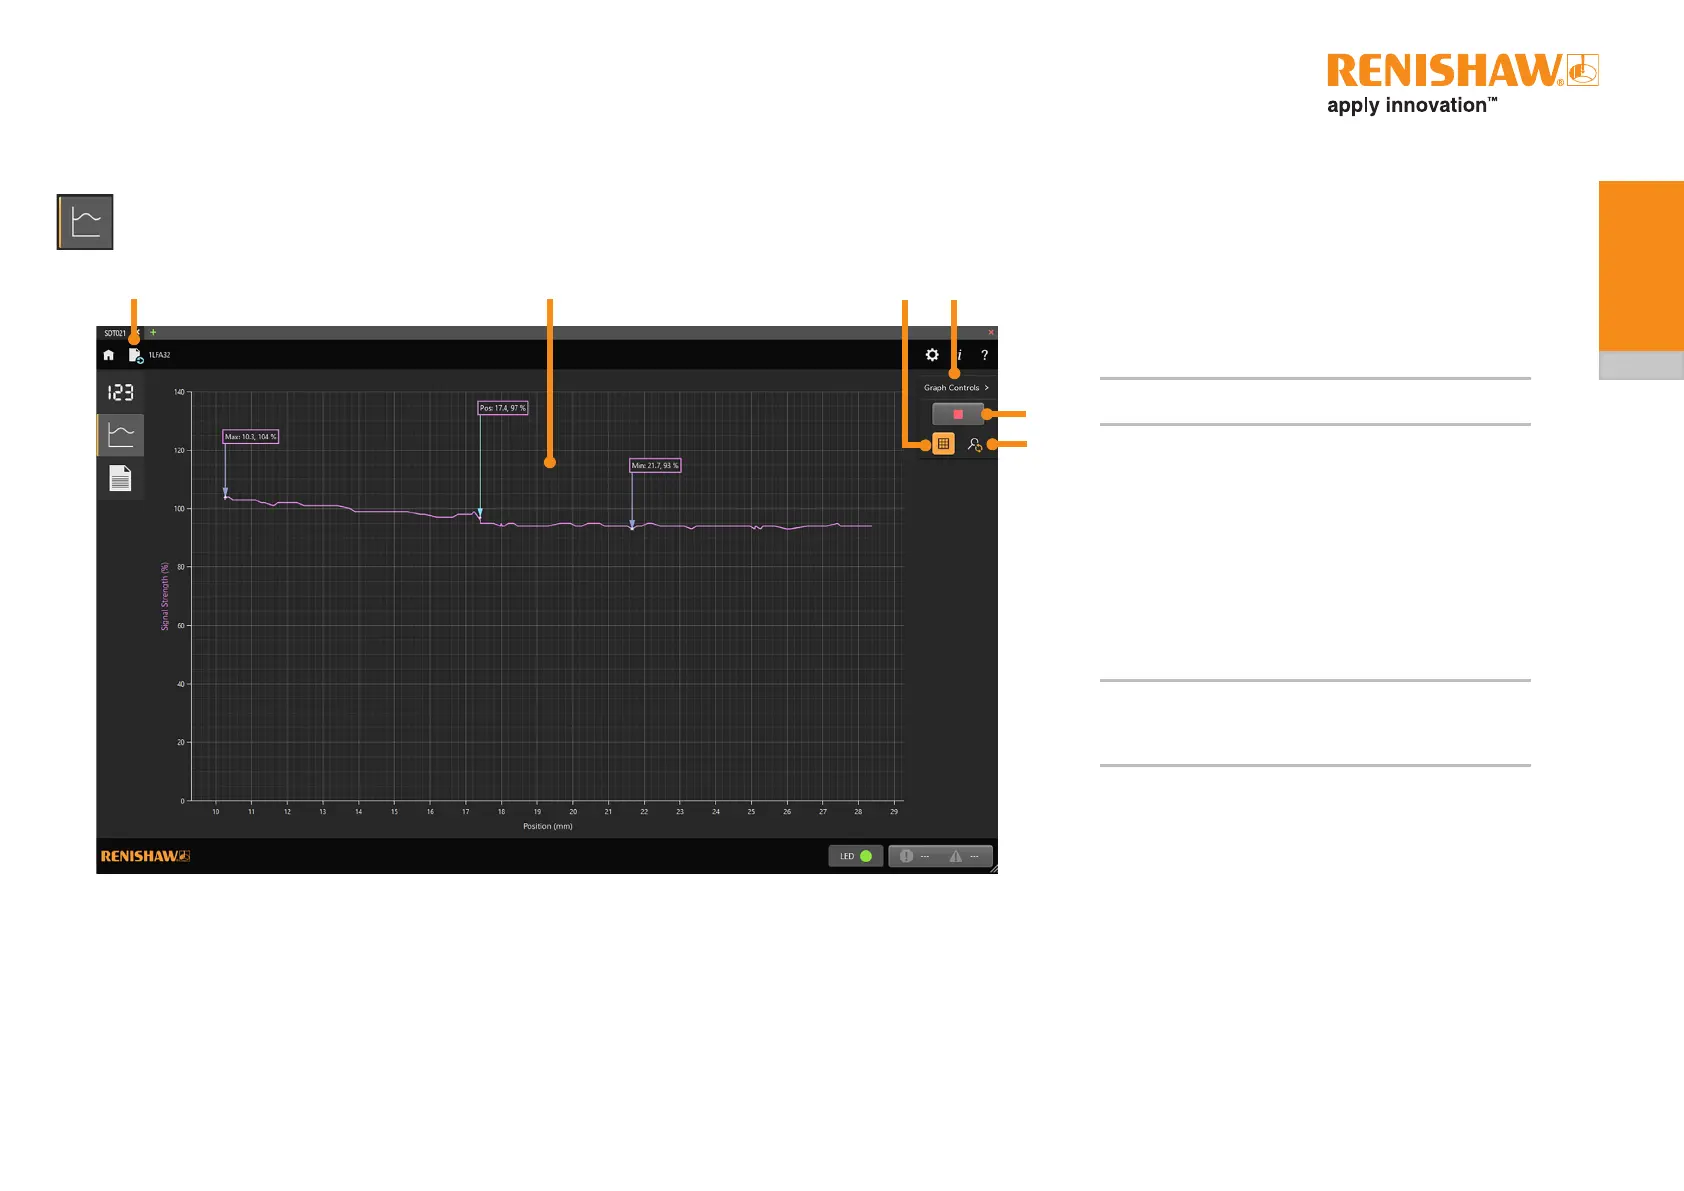
5.2 Signal strength vs position screen
5.2.1 Linear systems
Thesignalvspositionscreenplotsthesignalsizealongtheaxislength.
1 Save data
2 Plot of signal strength vs position
NOTE:Theplotcanbezoomedandpanned.Seesection
5.2.1.2 for more information.
3 Enable/disable plot grid lines
4 Select to show/hide Graph Controls
5 Start/stop a plot (section 5.2.1.1)
6 Reset Zoom
When an alarm or warning occurs, a pop-up describing the
error condition will be displayed for 3 seconds. See section
5.1.4 for more information on alarms and warnings.
Themaximumandminimumsignalstrengthsandthesignal
strengthatthecurrentpositionareshowninpurpleboxes.
NOTE:Themaximumspeedthatthereadheadcantravelover
the scale to display a useful Signal Strength/Position
plot is 0.5 m/s. Note that improved plot resolution is
possible at slower travelling speeds.
1
2
4
5
6
3
 Loading...