15
Bode Plot (for DHO914S and DHO924S only)
Bode plot is a way of graphically displaying the frequency response of a system. In
the switch power supply and operational amplifier's circuit feedback network, the
Bode plot provides the curves displaying the variation of gain and phase with the
frequency for a loop analysis. Through the analysis on the system's gain and phase
margins, you can determine the stability of the system.
With the built-in signal generator module, the DHO914S and DHO924S series
generate the sweep signal of a specified frequency range and outputs to the switch
power supply circuit under test. Then, the oscilloscope draws a Bode plot displaying
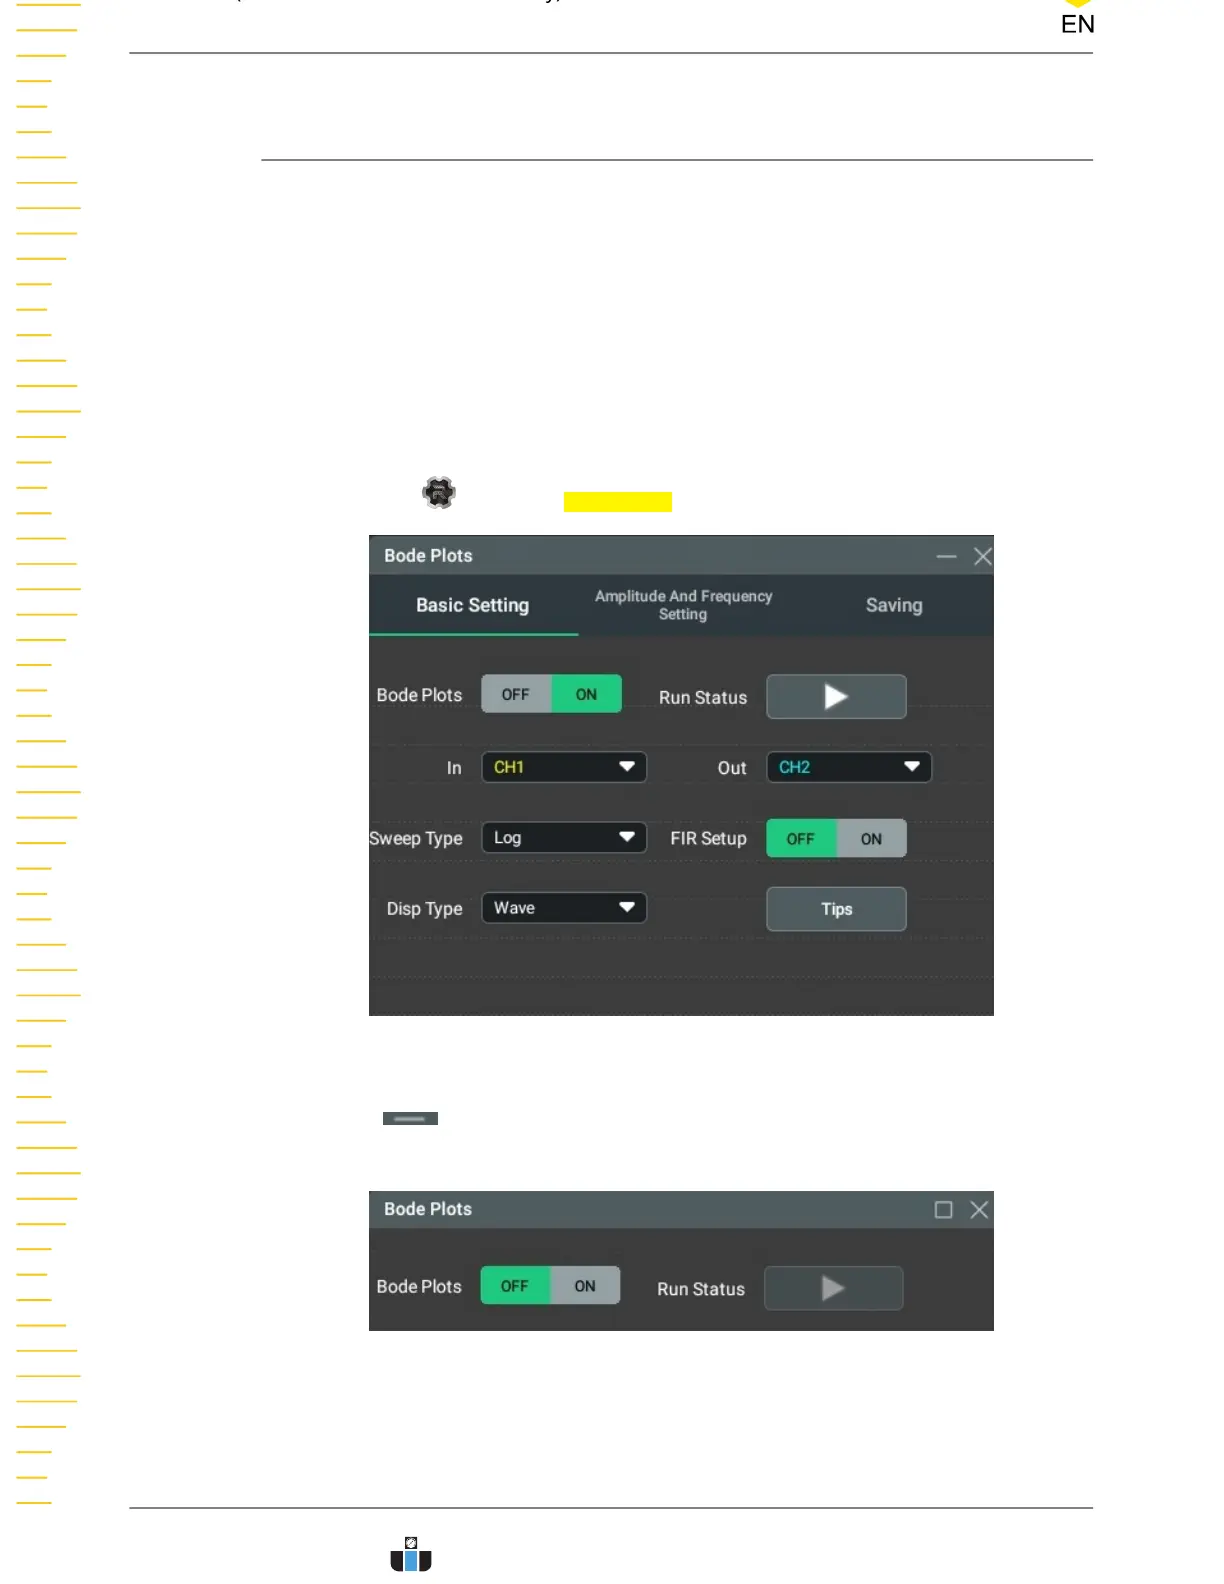
the variation of phase and gain with different frequencies. Click or tap the function
navigation icon
and select Bode Plots to enter the "Bode Plots" setting menu.
Figure 15.1 "Bode Plots" Setting Menu
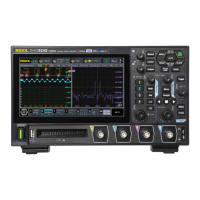
Click or tap to minimize the "Bode Plots" menu to simplify the display, as
shown in the figure below.
Figure 15.2 "Bode Plots" Setting Menu-Simplified Mode
Bode Plot (for DHO914S and DHO924S only)
DHO900 User Guide
178
Copyright ©RIGOL TECHNOLOGIES CO., LTD. All rights reserved.
www.calcert.com sales@calcert.com1.888.610.7664
0
5
10
15
20
25
30