Vers.: 20230710ENG
Page 41
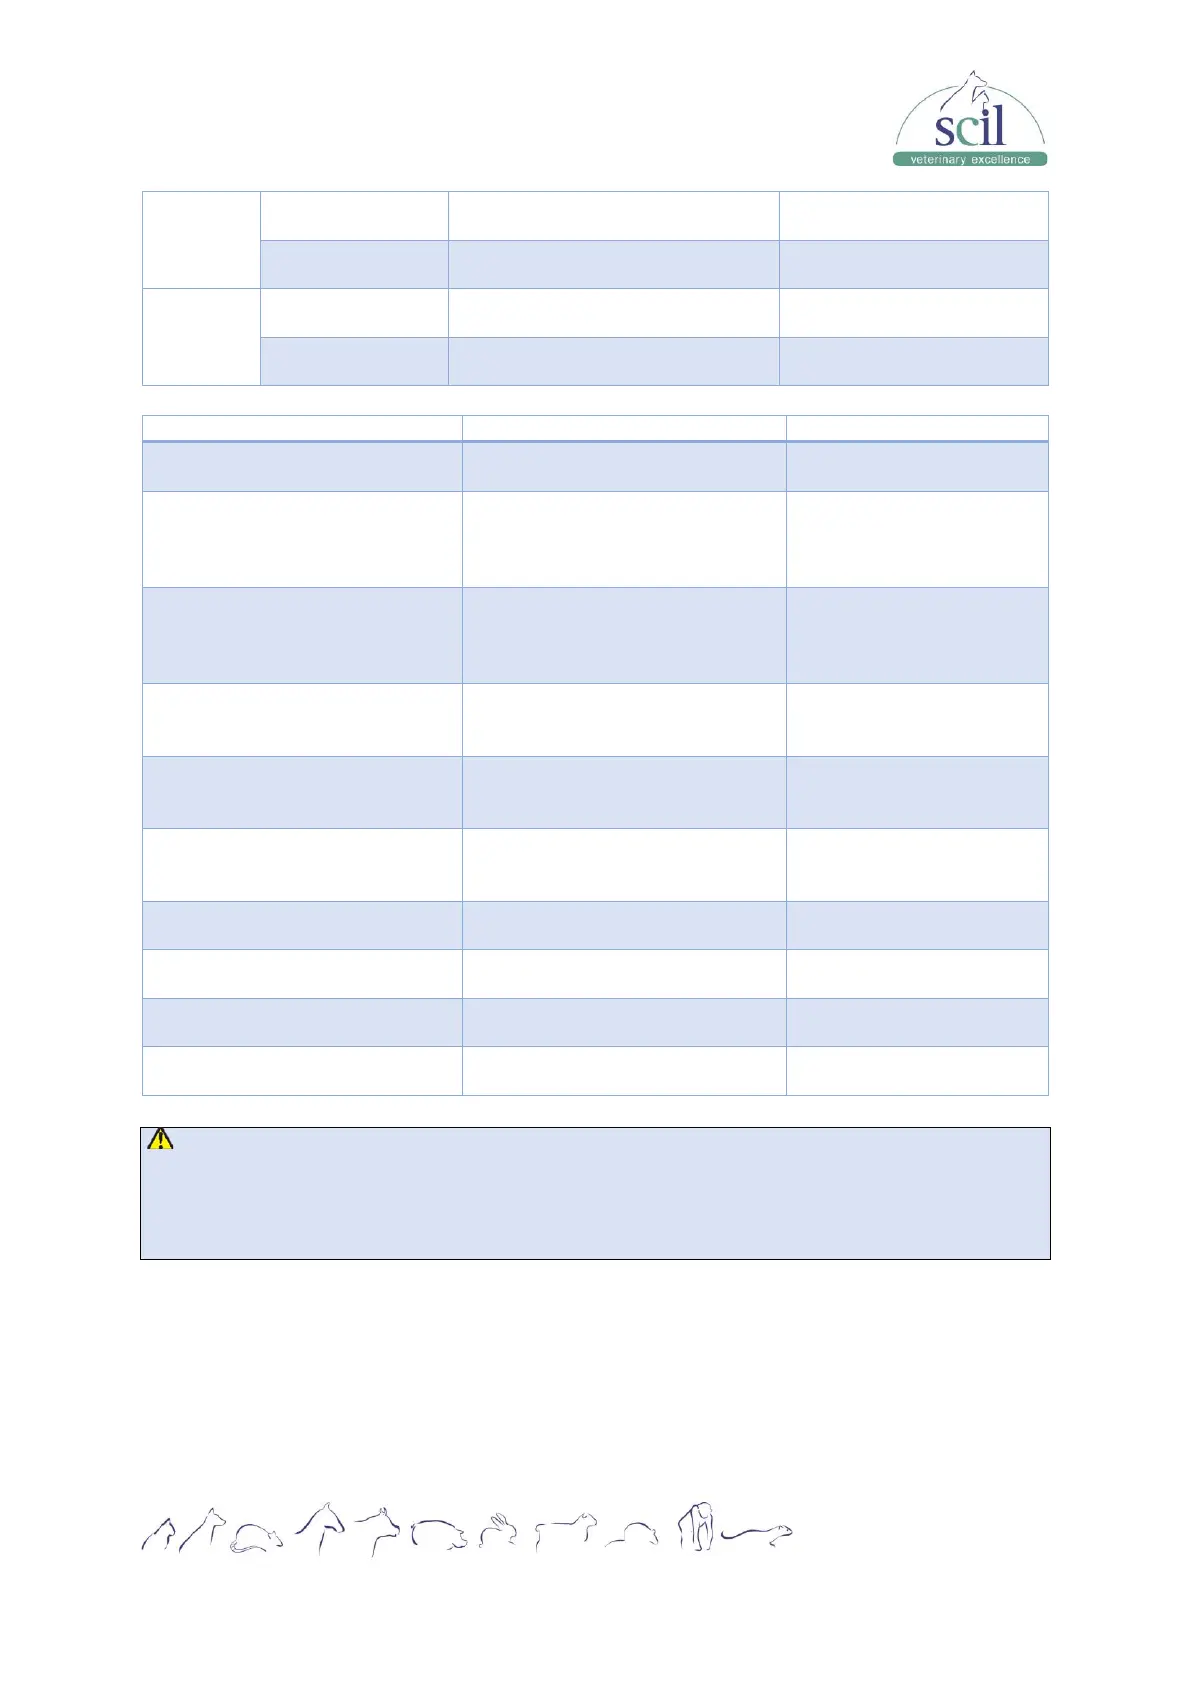
MCHC > 10% below
lower normal range limit.
MCHC > 10% above
upper normal range limit.
PLT# > 25% below
lower normal range limit.
PLT# > 50% above
upper normal range limit.
DIFF scattergram abnormal
The Diff channel scattergram
is abnormal.
Possible presence of abnormal
lymphocytes
Presence of excessive dots in
abnormal lymphocyte
sensitive region of the
scattergram
Possible presence of immature
granulocytes
Presence of excessive dots in
immature granulocyte
sensitive region of the
scattergram
Possible presence of Band Cell
Presence of excessive dots in
band cell sensitive region of
the scattergram
Possible presence of lipid particles
Presence of excessive dots in
lipid particle sensitive region
of the scattergram
Possible presence of nucletaed red
blood cells
Presence of excessive dots in
NRBC sensitive region of the
scattergram
Abnormal distribution of RBC
histogram
The distribution of RBC
histogram is abnormal.
Dimorphic population distribution
Presence of two or more
peaks on the RBC histogram
Abnormal distribution of PLT
scattergram
The distribution of PLT
scattergram is abnormal.
Calculate and compare
special parameters.
CAUTION
Abnormal cells may not necessarily trigger the flags during the analysis process, it is
recommended that re-examination is conducted per the operation instruction of your
laboratory.
7 Using the QC program
7.1 Introduction
Quality Control (QC) consists of strategies and procedures that measure the precision and
stability of the analyzer. The results imply the reliability of the sample results.