PLC WorkShop for Simatic TI505 FTTrend •
••
• 1
FTTrend
Overview
FTTrend displays real-time data collected from multiple PLC devices or
historical data collected from the FTLogger. This information is
displayed in a graph with up to 256 points per graph. You can view
different devices on the same graph and control how often the
information is gathered and displayed.
Creating a Trend Window
To create a new Trend Window:
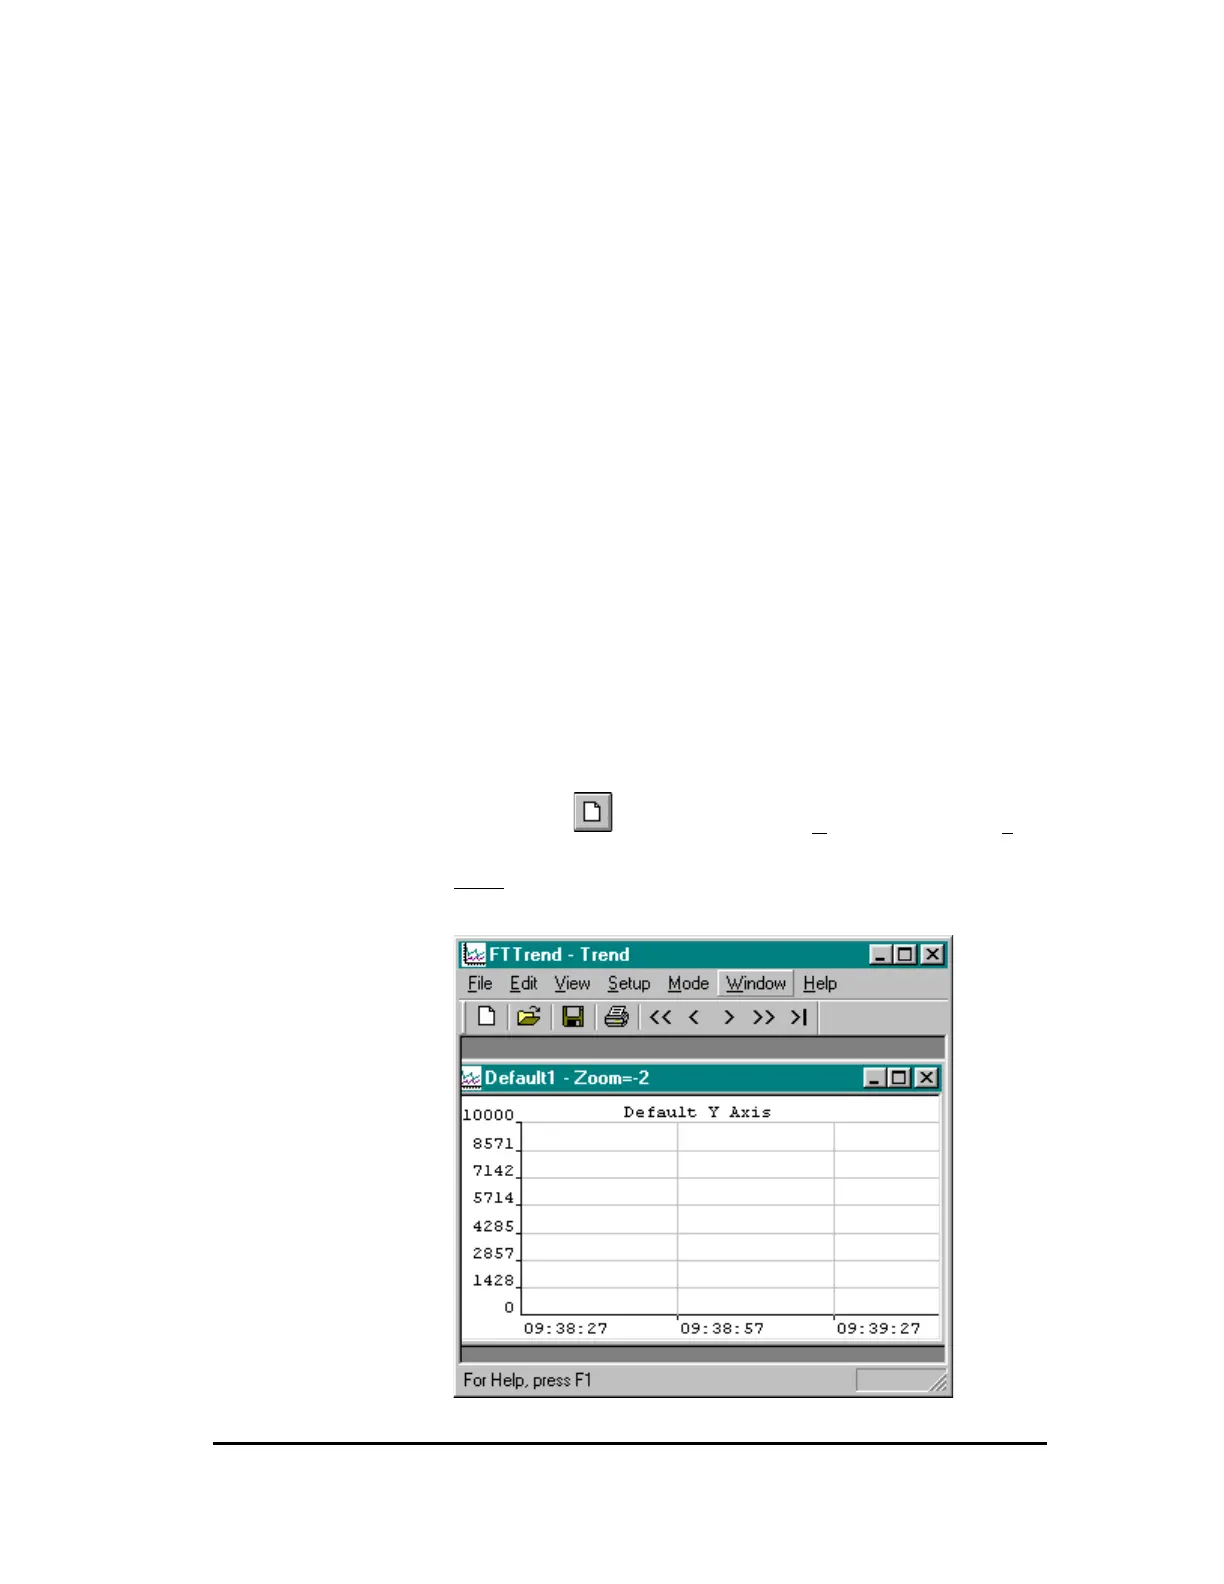
• First launch FTTrender
• Click
on the Toolbar or select New Program from the File
menu.
Result: A default trend widow appears (figure 1)
Figure 1



 To Next Page