Examples
28
A
IBI
C
D
E F G H
I
I J
K L M N
1
2 3 4 3 2 3 4 3 4
2 3
2
3
SCALED
BAR
GRAPH
4
5
5
4.5
6
4
*** *** ***
7
3.5
***
***
***
8
3
*** ***
*** *** *** ***
***
9
2.5
*** *** *** *** *** ***
***
***
10
2
*** *** ***
*** *** *** *** ***
*** ***
***
11
1
.5
***
***
***
*** *** ***
*** *** ***
*** ***
12
1
*** ***
*** *** *** ***
***
***
*** ***
***
***
13
0.5
*** *** *** ***
*** *** *** *** ***
***
***
***
14
0
I
--------------------------------------------
15
Jan Feb Mar
Apr
May
Jun Ju l
Aug
Sep
Oct
Nov
Dec
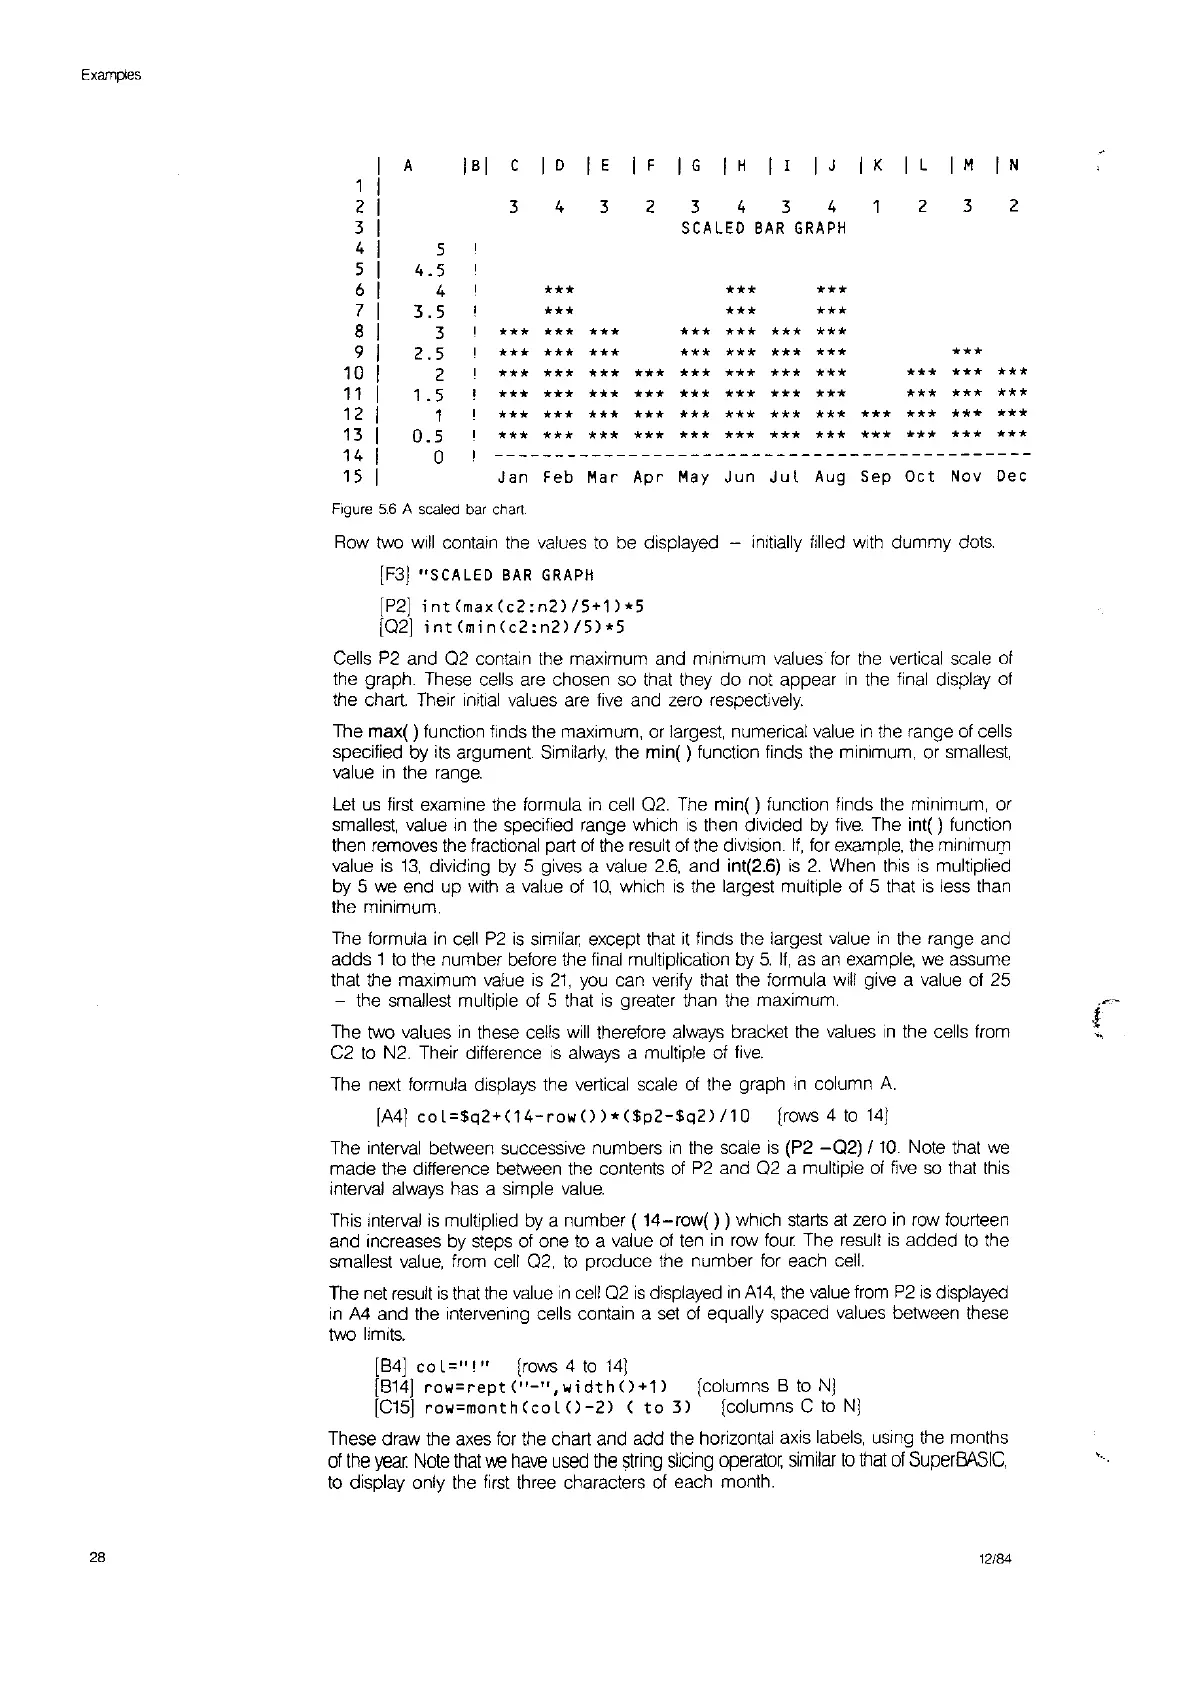
Figure
5.6
A
scaled
bar
chart
Row
two
will
contain the values
to
be
displayed - initially filled
with
dummy
dots.
[F3]
"SCALED
BAR
GRAPH
[P2]
intCmax(c2:n2)/5+1)*5
[021
int(min(c2:n2'/5)*5
Cells
P2
and
02
contain the maximum and minimum values
for
the vertical scale
of
the graph.
These
cells
are
chosen so that they do not appear
In
the
final
display
at
the chart. Their
initial
values
are
tive
and zero respectively.
The max( ) function finds the maximum, or largest, numerical value
in
the range
of
cells
specified by
its
argument
Similarly,
the min( ) function finds the minimum, or
smallest,
value
in
the
range.
Let
us
first
examine the formula
in
cell
02.
The mini ) function finds the minimum, or
smallest, value
,n
the specified range which
IS
then divided
by
five.
The int( ) function
then removes the fractional part
of
the result
of
the
diVision.
If,
for example, the minimum
value
is
13,
dividing
by
5 gives a value
2.6,
and int(2.6)
is
2.
When
this
IS
multiplied
by 5
we end up
with
a value
of
10,
which
is
the largest multiple
of
5 that
IS
less than
the minimum.
The formula
in
cell
P2
is
similar except that
it
finds the largest value
in
the range and
adds 1
to
the number before the
final
multiplication by
5.
If,
as
an
example,
we
assume
that the maximum value
is
21,
you can verify that the formula
will
give a value
of
25
- the smallest multiple
of
5 that
is
greater than the maximum.
The
two values
,n
these cells
will
therefore
always
bracket the values
,n
the cells from
C2
to
N2. Their difference
IS
always
a multiple of
five.
The next formula displays the vertical scale
of
the graph
in
column A
[A4]
col=$q2+(14-rowO)*($p2-$q2)/10
[rows 4
to
14)
The interval between successive numbers
in
the scale
is
(P2
-02)
/10. Note that
we
made the difference between the contents
of
P2
and
02
a multiple
of
five
so that this
Interval always has a simple
value.
This Interval
is
multiplied
by
a number (
14-row(
) ) which starts
at
zero
in
row fourteen
and increases by steps
of
one
to
a value
of
ten
in
row
four The result
is
added
to
the
smallest
value,
from
cell
02,
to
produce the number for each
cell.
The
net
result
is
that
the
value
in
cell
02
IS
displayed
in
A14,
the value
from
P2
IS
displayed
in
A4
and the intervening cells contain a
set
of
equally spaced values between these
two
limits.
[84] co
l="I"
[rows 4
to
14J
[8141
row=rept("-",widthO+1J
[columns 8
to
N)
[C15]
row=month(colO-2)
(
to
3)
[columns C
to
Nj
These draw the
axes
for
the chart and add the horizontal axis labels,
uSing
the months
of
the year Note
that
we
have
used
the
string
slicing
operator,
similar
to
that
of
SuperBtlSIC,
to display only the
first
three characters
of
each month.
12/84
~.-.