POINTS
AND
LINES
It
is
easy
to
draw points and lines
uSing
scale graphics. Using a vertical scale of 100 •
a point near the centre of the window can be plotted
With:
POINT
60,50
The point (60 units across and
50
units up)
Will
be plotted
in
the current ink colour.
Similarly a line may be drawn with the statement:
LINE
60,50
TO
80,90
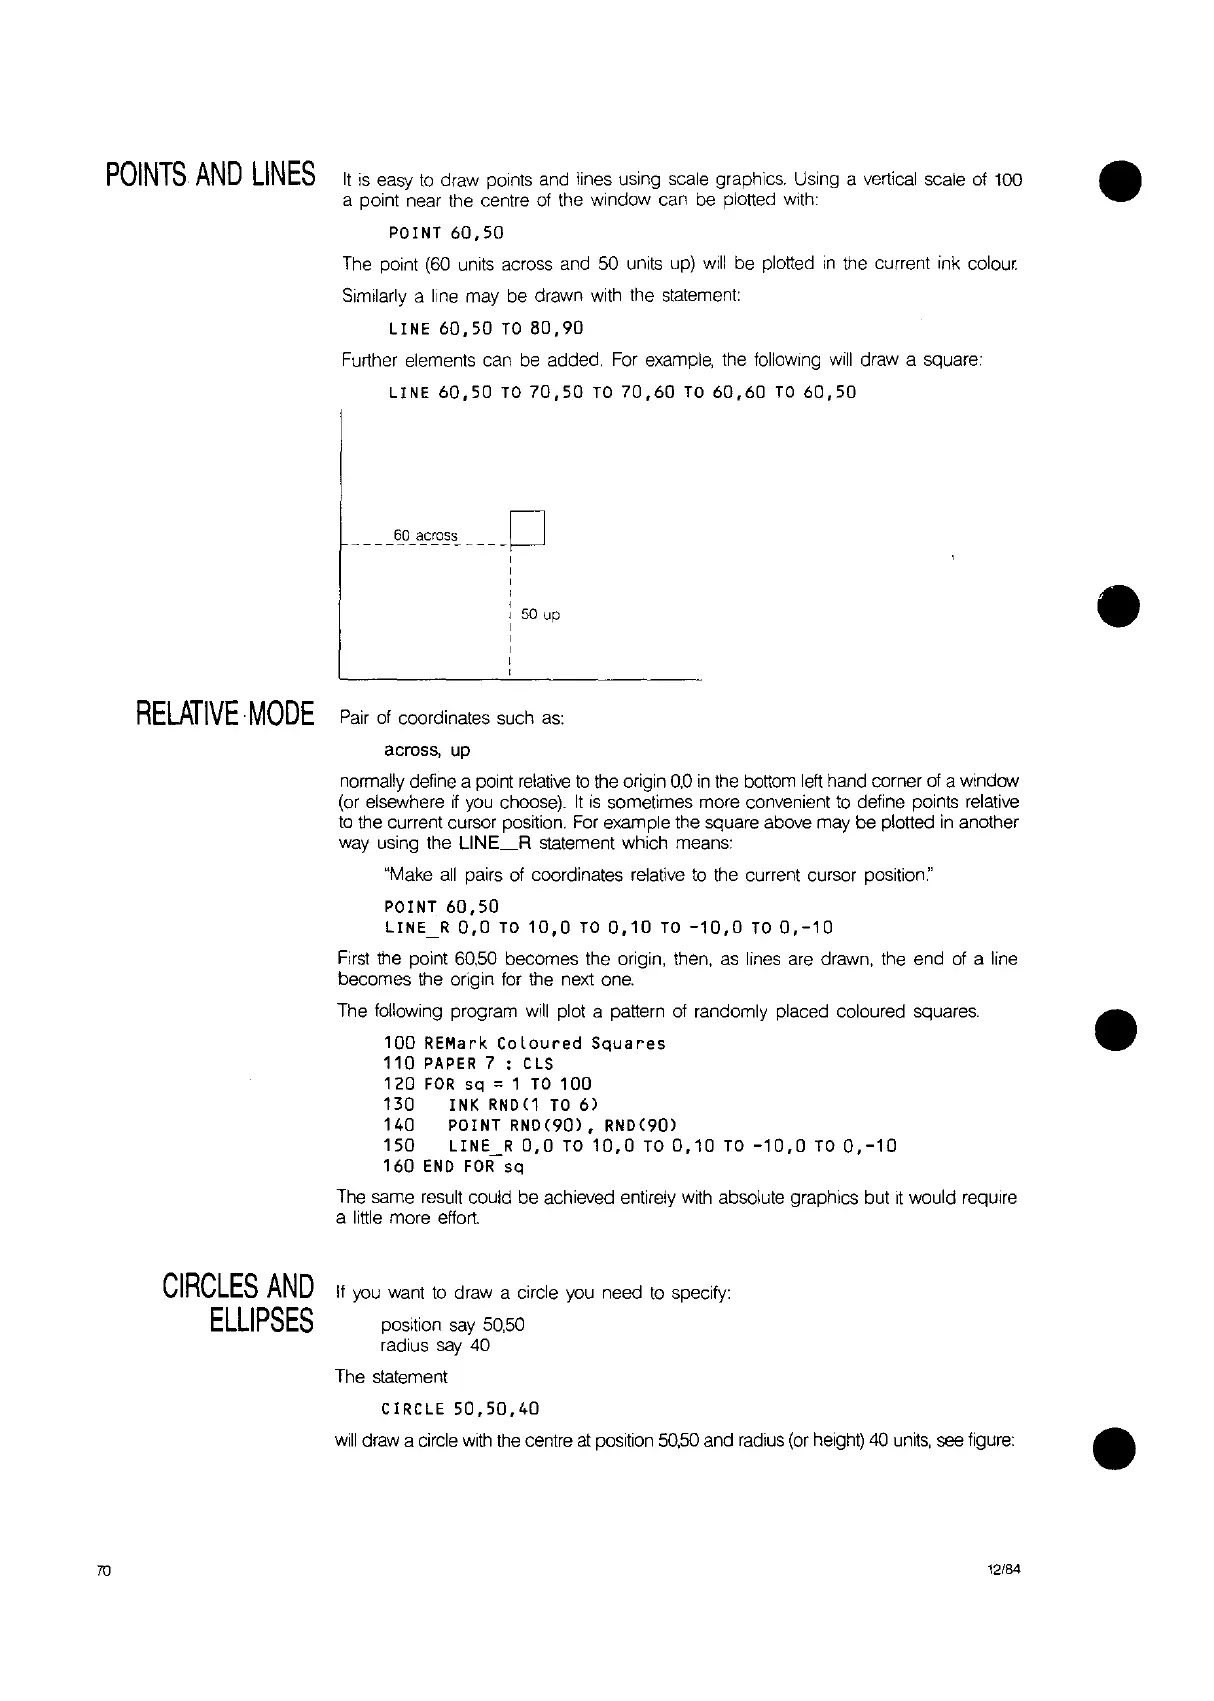
Further elements can be added. For example, the
follOWing
will
draw a square:
LINE
60,50
TO
70,50
TO
70,60
TO
60,60
TO
60,50
____
~~~c~~~~
c=J
,
,
,
,
,
I 50
up
,
,
,
,
,
RELATIVE·
MODE
Pair
of coordinates such as
across, up
normally define a point
relative
to
the origin 0,0
in
the bottom
left
hand corner of a window
(or elsewhere
if
you
choose).
It
is
sometimes more convenient
to
define points relative
to
the current cursor position. For example the square above may be plotted
in
another
way using the
L1NE_R
statement which means:
"Make
all
pairs of coordinates relative
to
the current cursor position:'
POINT
60,50
LINE_R
0,0
TO
10,0
TO
0,10
TO
-10,0
TO
0,-10
First
the point 60,50 becomes the origin, then,
as
lines are drawn, the end of a line
becomes the origin for the next one.
The following program
will
plot a pattern of randomly placed coloured squares.
100
REMark
Coloured
Squares
110
PAPER
7 :
CLS
120
FOR
sq
=1
TO
100
130
INK
RND
(1
TO
6)
140
POINT
RND(90),
RND(90)
150
LINE R
0,0
TO
10,0
TO
0,10
TO
-10,0
TO
0,-10
160
END
FOR
sq
The same result could be achieved entirely with absolute graphics but it would require
a little more effort.
•
•
70
CIRCLES
AND
ELLIPSES
If
you want
to
draw a circle you need
to
specify:
position
say
50,50
radius
say
40
The statement
CIRCLE
50,50,40
will
draw a circle
with
the
centre
at
position 50,50 and radius (or height)
40
units,
see figure:
12/84
•