Examples
Now Echo the contents
of
cell
X9
over
the
range from
X10
to
AM24,
to
fill
In
the
rest
of the table, and Echo the contents of cell
C9
to
column
V.
from
V9
to
V24
(this makes
a copy of the 'Sample'
values).
[X26] row=sum
(co
I)
[rows 9
to
24,
columns X
to
AM)
Any input wave that
IS
not a pure sine
or
pure cosine
wave
will
generally produce The Power Spectrum
components
in
both the sine and cosine transforms. Furthermore, when
you
calculate
the transform of many types
of
wave,
some
of
the
components
will
turn out
to
be
negative.
In
order
to
obtain results which combine both transforms, and are never negative,
we
shall make one more calculation.
This
will
add the squares of the sine and
COSine
components.
In
the case
of
a
real
wave
this result shows how much power (energy per
second)
IS
present
In
the
wave
at
each frequency, irrespective of whether
It
is
in
the
sine or the cosine components.
It
is
usually called the power spectrum
(a
spectrum
records how much of each frequency
IS
present).
In
this case
we
shall calculate the
square root of the power spectrum,
to
avoid having too large a range of values for the
simple graphical display
we
are
uSing.
[C28]
"Power
[E28]
row=sqr(cos.comp*cos.cornp
+
s;n.comp*s;n.comp)
[columns E
to
T)
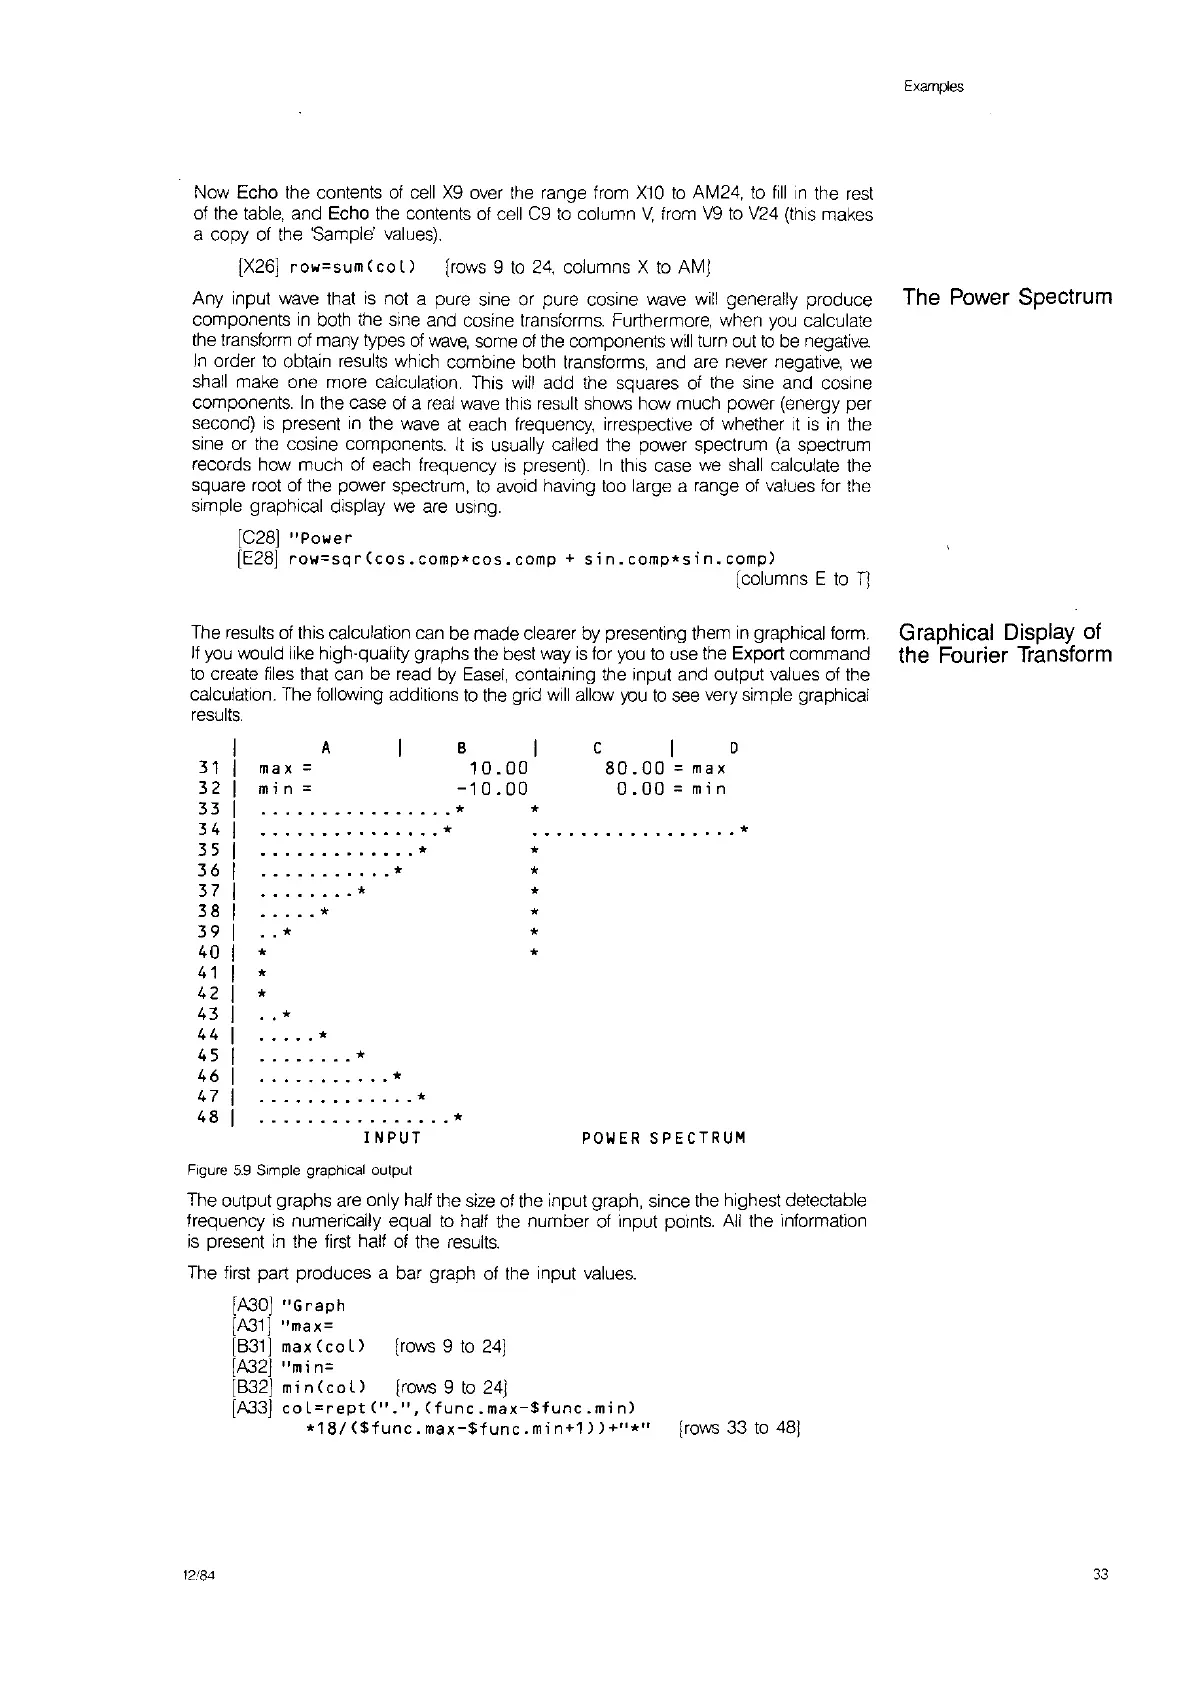
The
results
of this calculation can be made clearer by presenting them
in
graphical form.
If
you
would like high-quality graphs the best way
is
for you
to
use the Export command
to
create files that can be read by
Easel,
containing the input and output values of the
calculation. The following additions
to
the grid
will
allow
you
to
see very simple graphical
results.
Graphical Display of
the Fourier Transform
· *
INPUT
· *
· *
· *
· *
· *
*
*
*
C I D
80.00
= max
0.00
=
min
POWER
SPECTRUM
.................
*
*
*
*
*
*
*
*
B I
10.00
-10.00
A
*
*
rna
x =
mi n =
· *
*
· *
·
..
- *
*
31
32
33
34
35
36
37
38
39
40
41
42
43
44
45
46
47
48
Figure
5.9
Simple graphical output
The output graphs are only half the size of the input graph, since the highest detectable
frequency
is
numerically equal
to
half the number of input
pOints.
All
the information
is
present
in
the first half of the
results.
The
first
part produces a bar graph of the input values.
[A30]
"G
raph
[A31]
"max=
[631]
max
(co
L)
[rows 9
to
24]
[A32]
"mi
n=
[632]min(col)
[rows 9
to
24]
[A.33]
col=rept(II.I',
(func.max-$func.min)
*181
($func.
max-$func
. mi
n+1
»
+"*"
[rows 33
to
48)
12/84
33