Chapter 2 – Using the F4T Front Panel
Page 22 TestEquity F4T Controller
Trend Charts
Graphical Trend Charts provide a display of the temperature (and humidity in humidity
chambers) over time. This feature is only available for units with Rev. 3 firmware or higher, and
if this feature was purchased. All chambers shipped after May 5, 2016 have the Trend Chart
feature. This feature can be added to older chambers. Contact TestEquity for more information
and the cost to upgrade.
Up to four different trend charts can be set up. If you leave one chart to view another chart, you
will lose all previously displayed information.
The trend chart will only record one screen of date before writing over itself. You cannot
retrieve data that is not shown on the screen. If you want finer resolution and longer-term
data, you should use the Data Logging function instead.
To access trend charts, press the Menu button and then the Trending button. Press the Actions
button for Trend Chart 1. This chart has already been set up by TestEquity to display the
Temperature Process Value (and Humidity Process Value in humidity chambers) and the
respective Set Points.
Press View/Edit Details to change the chart name, grid display On/Off, auto-scaling On/Off, and
the horizontal timespan. If you change the timespan while the chart is running, you will lose
all previously displayed information. You will need to Stop and then Resume the trending for
changes in timespan to take effect.
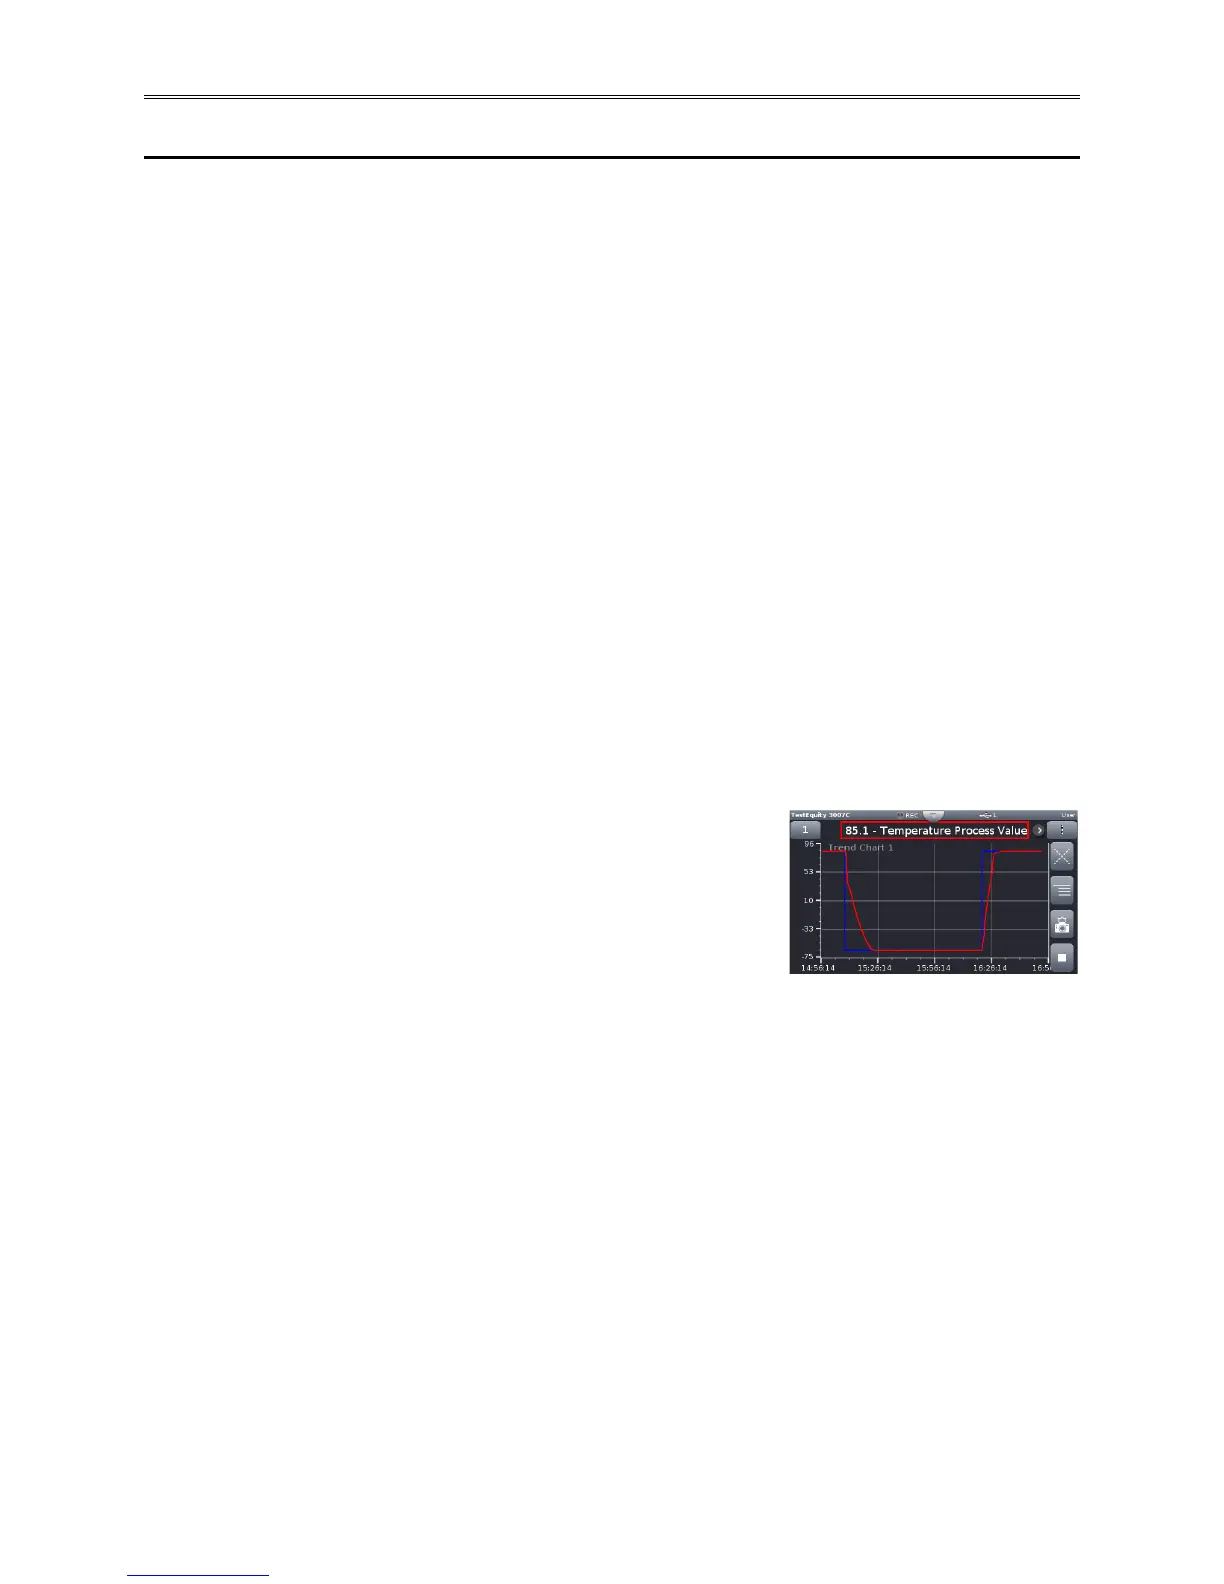
Press View to view the chart. When viewing the chart, you can
toggle between the values being charted by pressing the arrow
next to the highlighted box on the top of the screen
(Temperature Process Value of 85.1°C in this example, pressing
the arrow will show the Temperature Set Point).
Pressing the box with three horizontal dots on the right side of the screen will give you choices to
(listed in order of appearance):
• Turns the grid Off/On.
• Go to choices for View/Edit Details and Edit Pens.
• Take a snapshot (.bmp image) and save it to the USB thumb drive (you must have a thumb
drive plugged into the USB port to capture the snapshot).
• Stop/Resume the trending. If you stop the trending, you will lose all previously displayed
information once it is resumed. In the above image, the bottom button is shown in running
condition. When pressed (Stop), it till turn into a right-facing triangle.
You can leave the trend display, view the Home or other screens and come back to the trend
display without losing any information, as long as you do not change any of the volatile trend
settings. When you go back to the Trending menu you will see a clock icon, indicating that the
trending information is continuing to be recorded. Pressing Actions and View will return you to
the active trend chart.