EasyManuals Logo

Texas Instruments TI-84 PLUS - Graphing Calculator User Manual

Texas Instruments TI-84 PLUS - Graphing Calculator
422 pages
To Next Page IconTo Next Page
To Previous Page IconTo Previous Page
Page #119 background imageLoading...
Page #119 background image
Chapter 6: Sequence Graphing 112
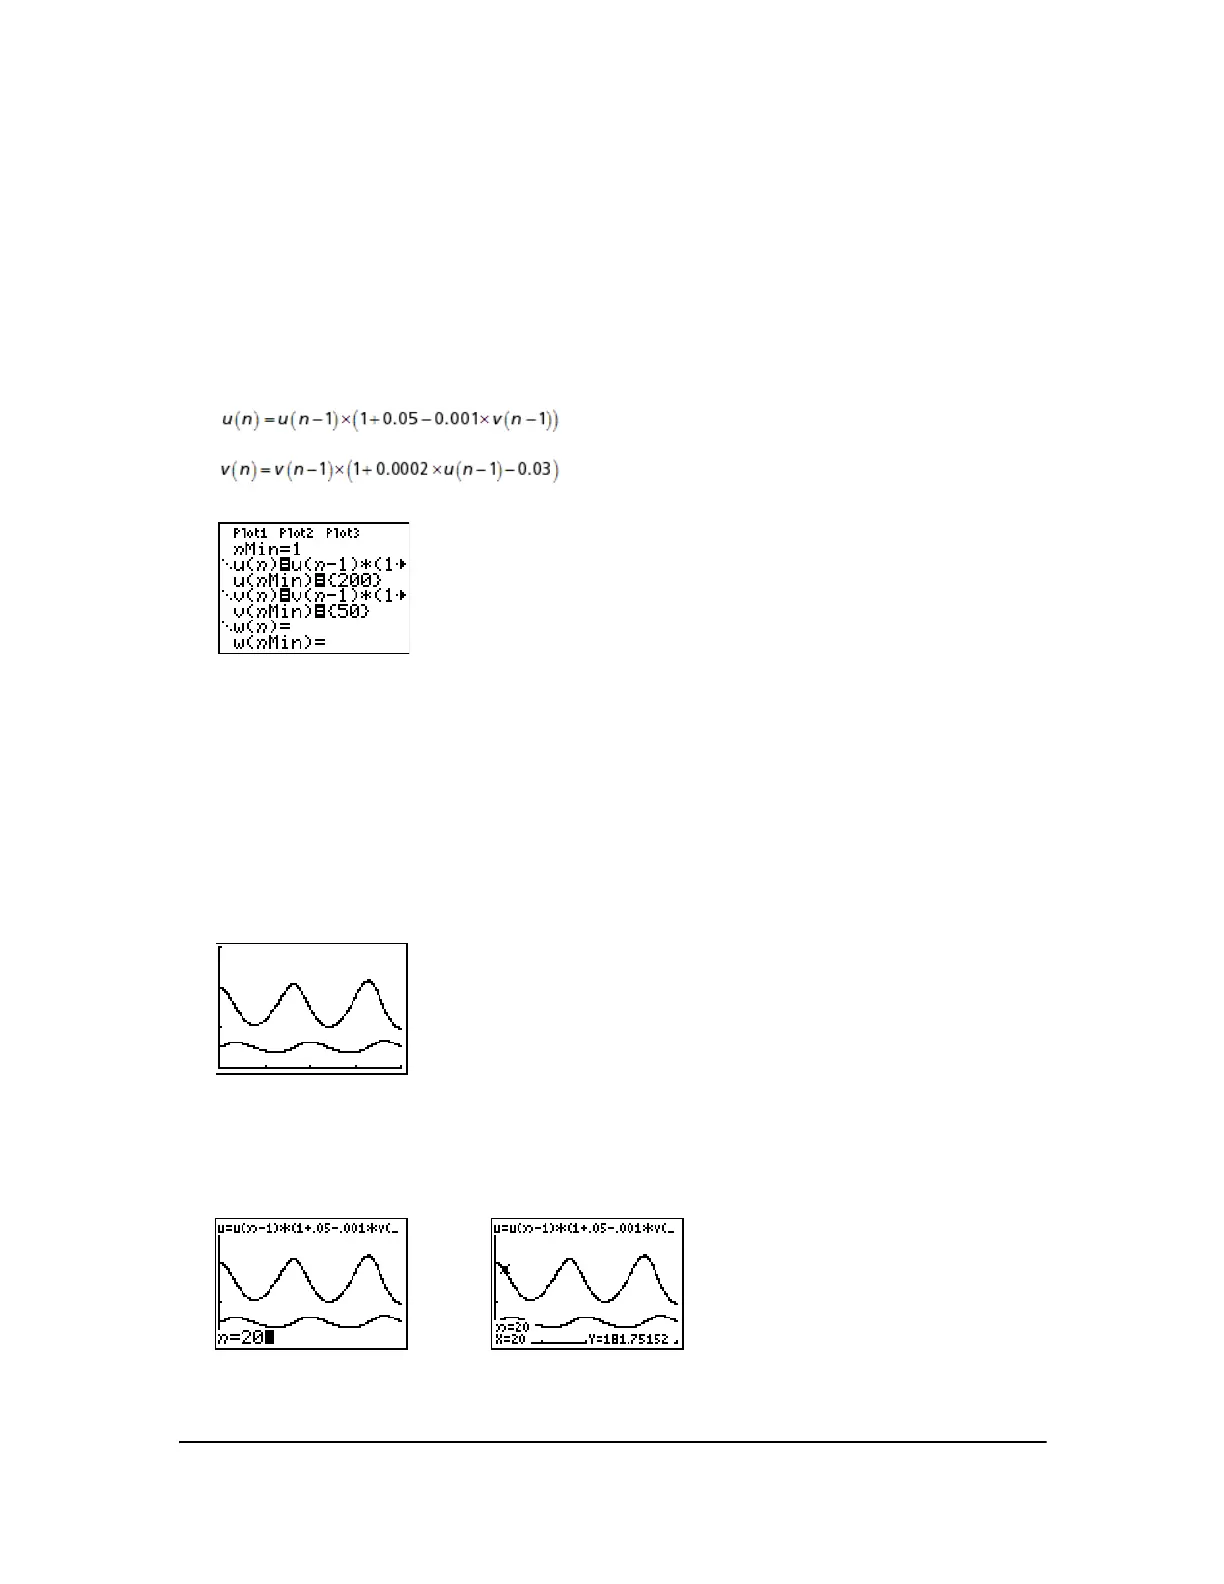
1. Press o in Seq mode to display the sequence Y= editor. Define the sequences and initial
values for R
n
and W
n
as shown below. Enter the sequence R
n
as u(n) and enter the sequence
W
n
as v(n).
2. Press y . Í to select Time axes format.
3. Press p and set the variables as shown below.
4. Press s to graph the sequence.
5. Press r ~ to individually trace the number of rabbits (u(n)) and foxes (v(n)) over time (n).
Note: Press a number, and then press Í to jump to a specific n value (month) while in
TRACE.
D = fox population death rate without rabbits (.03)
n = time (in months)
R
n
=
R
nN1
(1+MNKW
nN1
)
W
n
=
W
nN1
(1+GR
nN1
ND)
nMin=0
nMax=400
PlotStart=1
PlotStep=1
Xmin=0
Xmax=400
Xscl=100
Ymin=0
Ymax=300
Yscl=100

Table of Contents

Questions and Answers:

Question and Answer IconNeed help?

Do you have a question about the Texas Instruments TI-84 PLUS - Graphing Calculator and is the answer not in the manual?

Texas Instruments TI-84 PLUS - Graphing Calculator Specifications

General IconGeneral
TypeGraphing Calculator
Display TypeLCD
Screen Resolution96 x 64 pixels
ProcessorZilog Z80
Memory24 KB RAM, 480 KB Flash ROM
Power Source4 AAA batteries (with backup lithium battery)
ConnectivityI/O port
Weight7.4 oz (210 g)
SoftwareTI-OS (Texas Instruments Operating System)

Related product manuals