EasyManuals Logo

Texas Instruments TI-84 PLUS - Graphing Calculator User Manual

Texas Instruments TI-84 PLUS - Graphing Calculator
422 pages
To Next Page IconTo Next Page
To Previous Page IconTo Previous Page
Page #179 background imageLoading...
Page #179 background image
Chapter 11: Lists 172
Using Select( to Select Data Points from a Plot
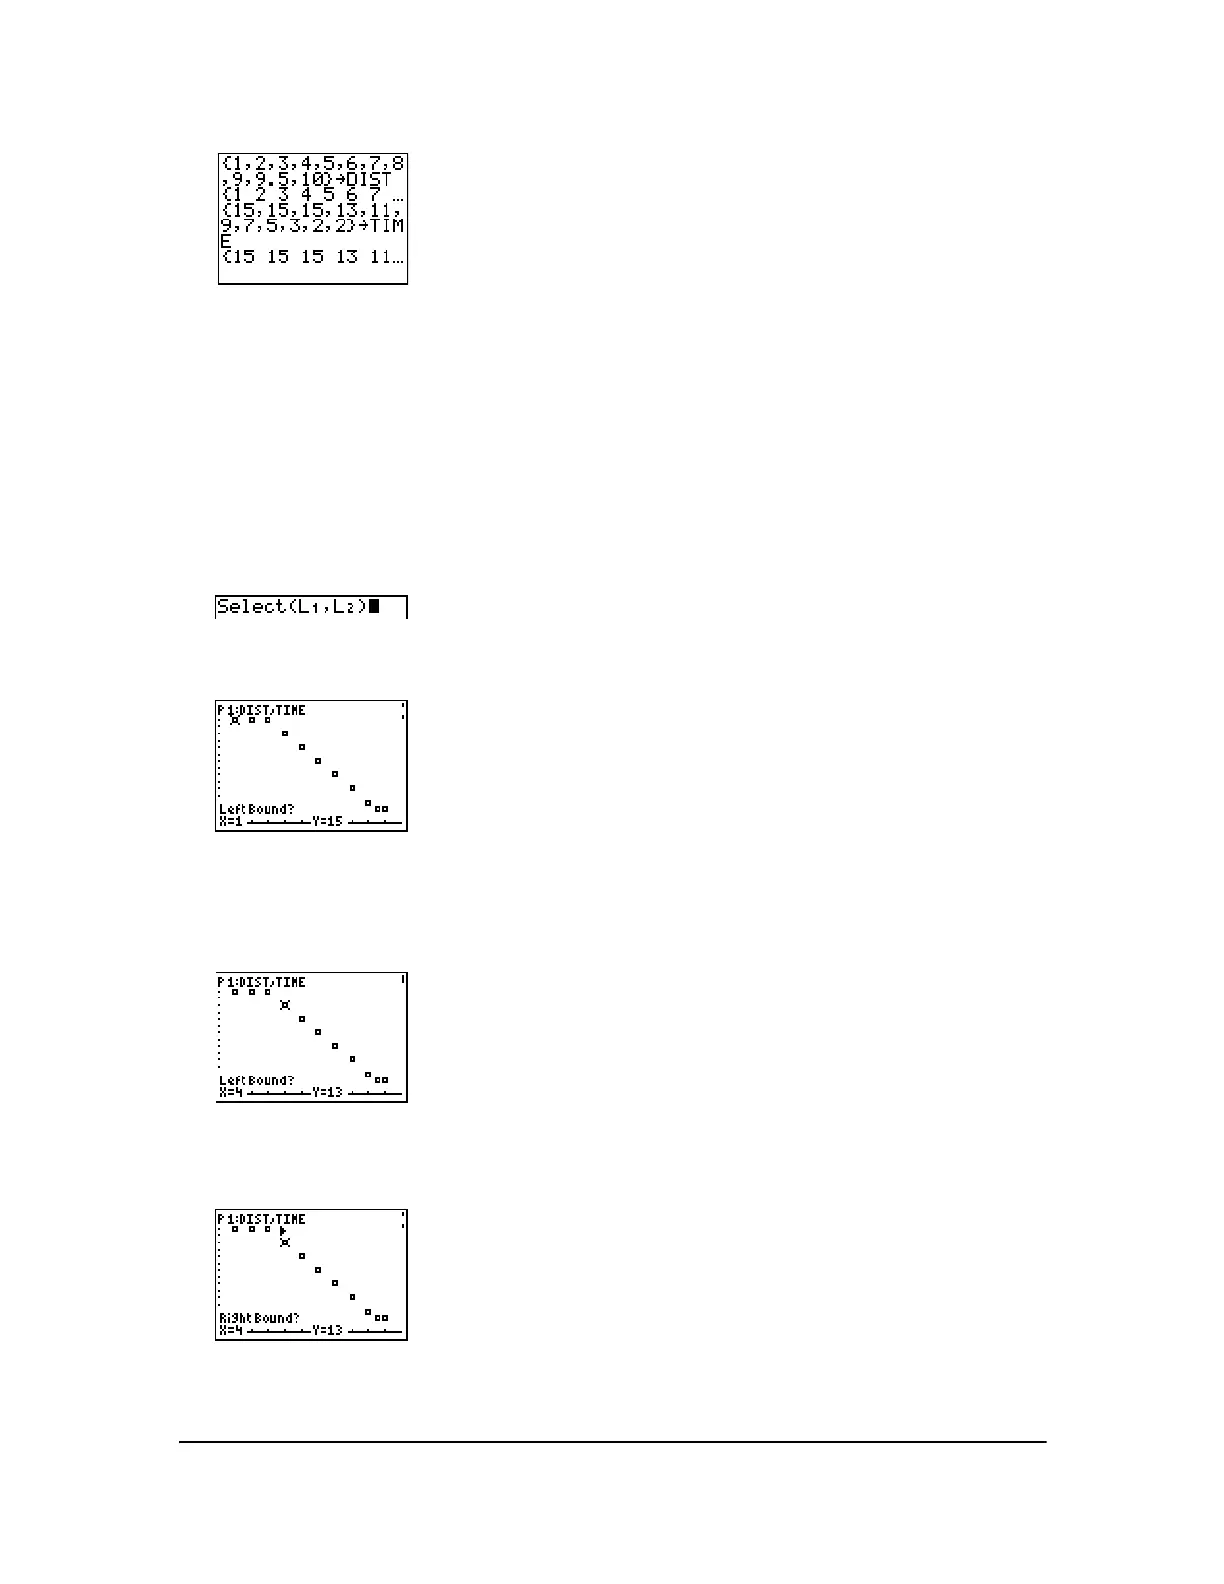
To select data points from a scatter plot or xyLine plot, follow these steps.
1. Press y 9 ~ 8 to select 8:Select( from the LIST OPS menu. Select( is pasted to the home
screen.
2. Enter xlistname, press ¢, enter ylistname, and then press ¤ to designate list names into which
you want the selected data to be stored.
3. Press Í. The graph screen is displayed with Left Bound? in the bottom-left corner.
4. Press } or (if more than one stat plot is selected) to move the cursor onto the stat plot from
which you want to select data points.
5. Press | and ~ to move the cursor to the stat plot data point that you want as the left bound.
6. Press Í. A 4 indicator on the graph screen shows the left bound. Right Bound? is
displayed in the bottom-left corner.
Classic

Table of Contents

Questions and Answers:

Question and Answer IconNeed help?

Do you have a question about the Texas Instruments TI-84 PLUS - Graphing Calculator and is the answer not in the manual?

Texas Instruments TI-84 PLUS - Graphing Calculator Specifications

General IconGeneral
TypeGraphing Calculator
Display TypeLCD
Screen Resolution96 x 64 pixels
ProcessorZilog Z80
Memory24 KB RAM, 480 KB Flash ROM
Power Source4 AAA batteries (with backup lithium battery)
ConnectivityI/O port
Weight7.4 oz (210 g)
SoftwareTI-OS (Texas Instruments Operating System)

Related product manuals