Chapter 12: Statistics 202
QuartReg—(ax
4
+bx
3
+cx
2
+ dx+e)
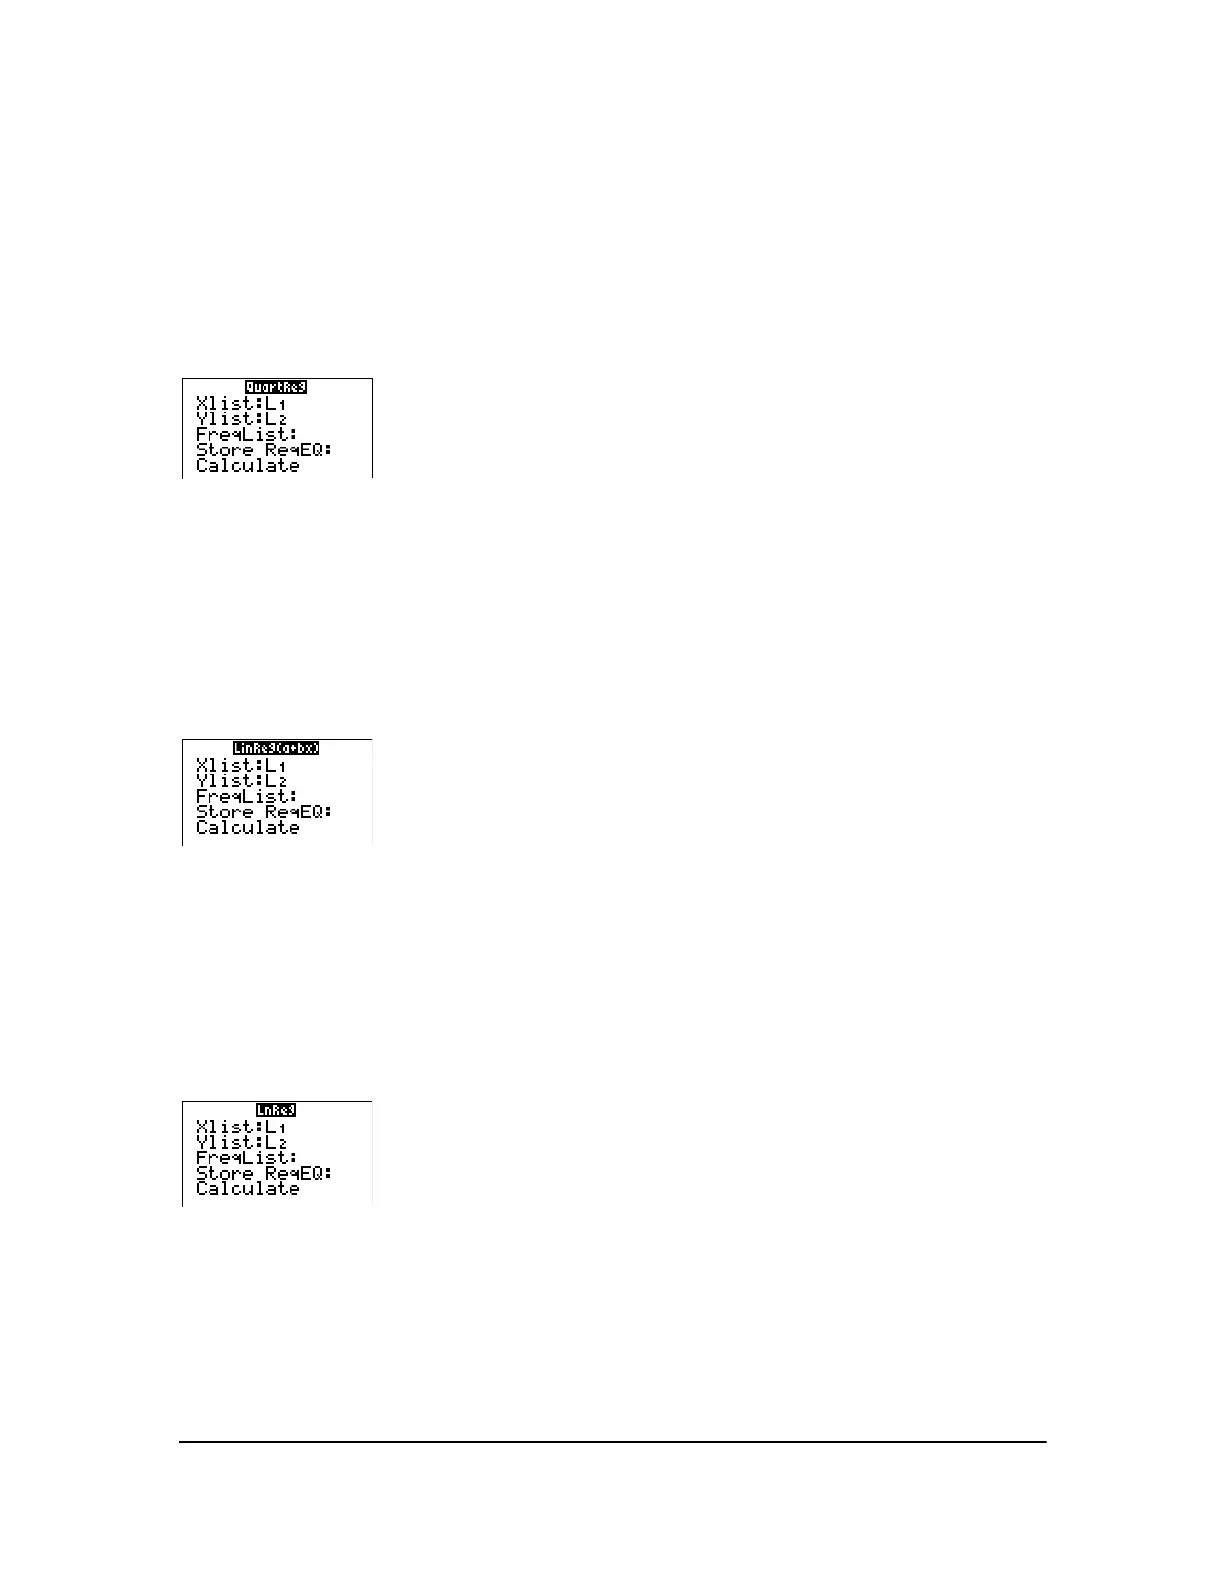
QuartReg (quartic regression) fits the fourth-degree polynomial y=ax
4
+bx
3
+cx
2
+dx+e to the data. It
displays values for
a, b, c, d, and e; when DiagnosticOn is set, it also displays a value for R
2
. For
five points, the equation is a polynomial fit; for six or more, it is a polynomial regression. At least
five points are required.
QuartReg [Xlistname,Ylistname,freqlist,regequ]
LinReg—(a+bx)
LinReg(a+bx) (linear regression) fits the model equation y=a+bx to the data using a least-squares fit.
It displays values for
a (y-intercept) and b (slope); when DiagnosticOn is set, it also displays values
for
r
2
and r.
LinReg(a+bx) [Xlistname,Ylistname,freqlist,regequ]
LnReg—(a+b ln(x))
LnReg (logarithmic regression) fits the model equation y=a+b ln(x) to the data using a least-
squares fit and transformed values ln(x) and y. It displays values for
a and b; when DiagnosticOn is
set, it also displays values for
r
2
and r.
LnReg [Xlistname,Ylistname,freqlist,regequ]
ExpReg—(ab
x
)
ExpReg (exponential regression) fits the model equation y=ab
x
to the data using a least-squares fit
and transformed values x and ln(y). It displays values for
a and b; when DiagnosticOn is set, it also
displays values for
r
2
and r.
 Loading...


