Chapter 12: Statistics 213
1. Press y , to display the STAT PLOTS menu.
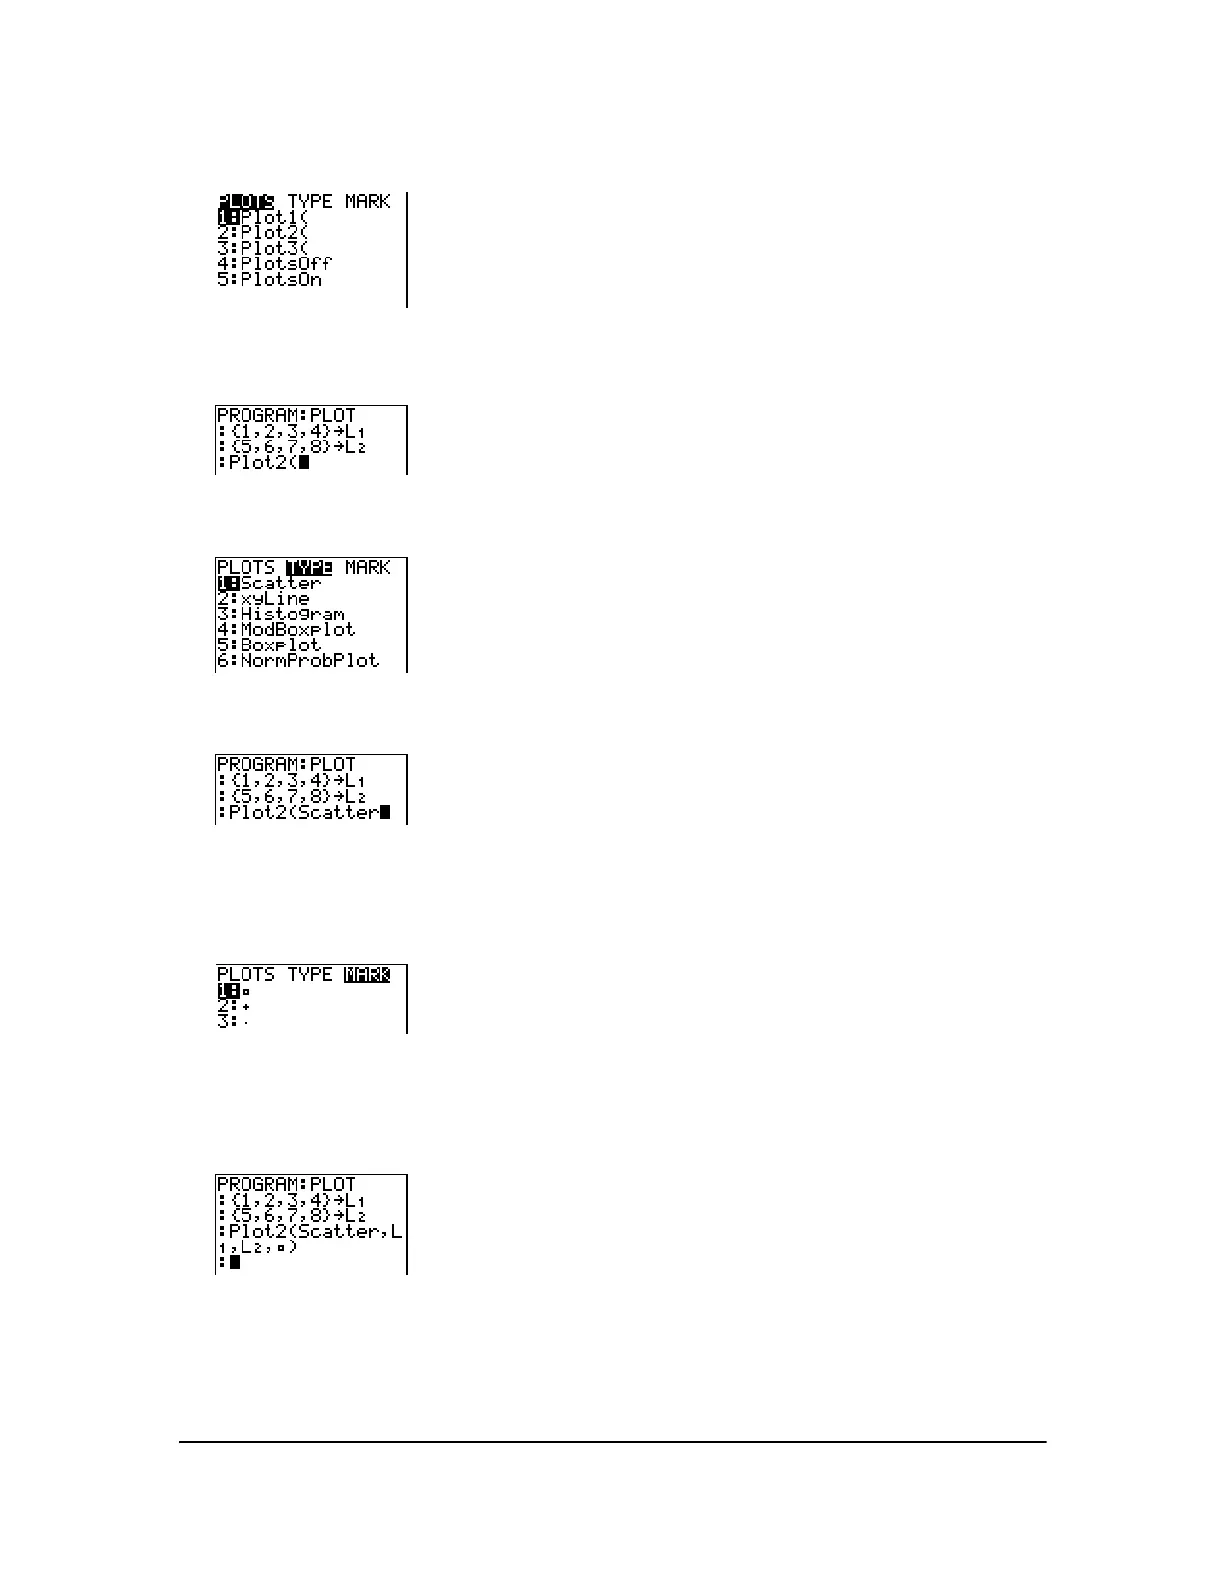
2. Select the plot to define, which pastes Plot1(, Plot2(, or Plot3( to the cursor location.
3. Press y , ~ to display the STAT TYPE menu.
4. Select the type of plot, which pastes the name of the plot type to the cursor location.
5. Press ¢. Enter the list names, separated by commas.
6. Press ¢ y , | to display the STAT PLOT MARK menu. (This step is not necessary if
you selected
3:Histogram or 5:Boxplot in step 4.)
Select the type of mark (› or + or ¦) for each data point. The selected mark symbol is pasted to
the cursor location.
7. Press ¤ Í to complete the command line.

 Loading...


