104 Activities
Setting Up a Parametric Graph and Table
Perform the following steps to study the flight of a hit baseball that has
an initial velocity of 95 feet per second and an initial angle of 32 degrees.
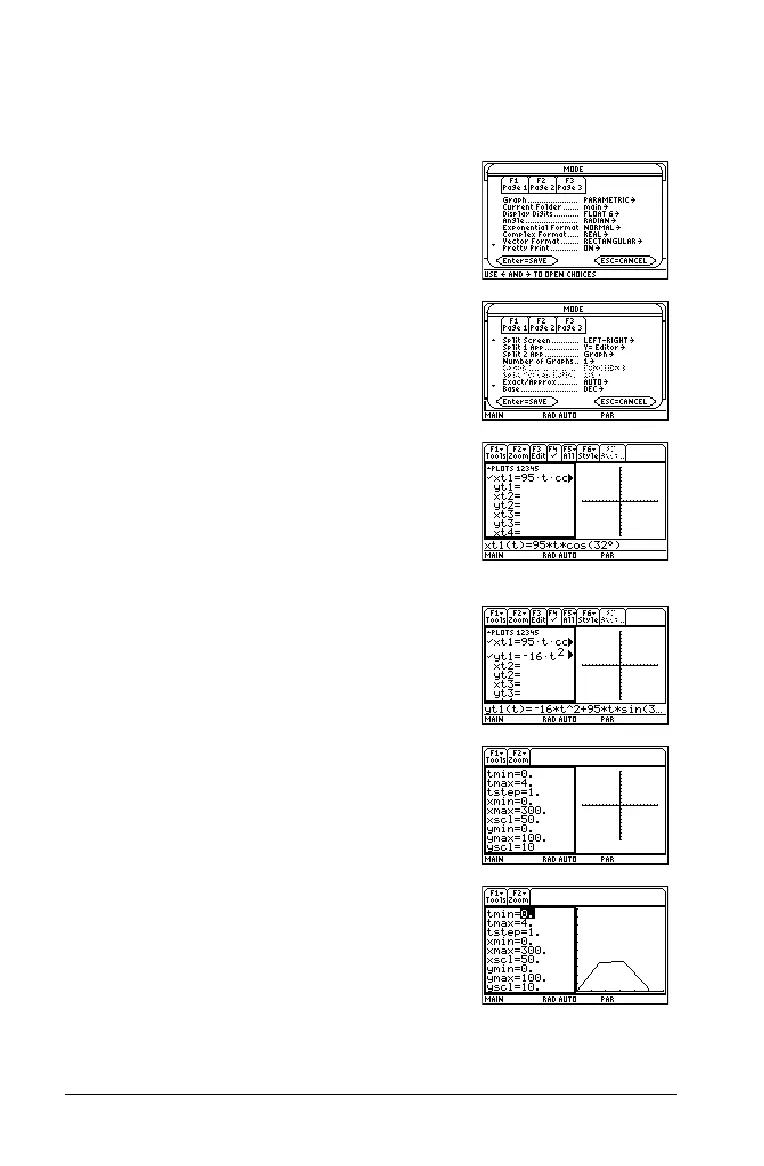
1. Set the modes for
Page 1 as shown in this
screen.
2. Set the modes for
Page 2 as shown in this
screen.
3. In the Y= Editor on the left side, enter the
equation for the distance of the ball at time
t for xt1(t).
xt1(t)=95†t†cos(32¡)
Note: Press 2 “ to obtain the degree
symbol.
4. In the Y= Editor, enter the equation for the
height of the ball at time t for
yt1(t).
yt1(t)=L16†t^2+95†t†sin(32¡)
5. Set the Window variables to:
t values= [0,4,.1]
x values= [0,300,50]
y values= [0,100,10]
6. Switch to the right side and display the
graph.
Note: Press 2 a.

 Loading...


