Appendix A: Functions and Instructions 225
QuadReg MATH/Statistics/Regressions menu
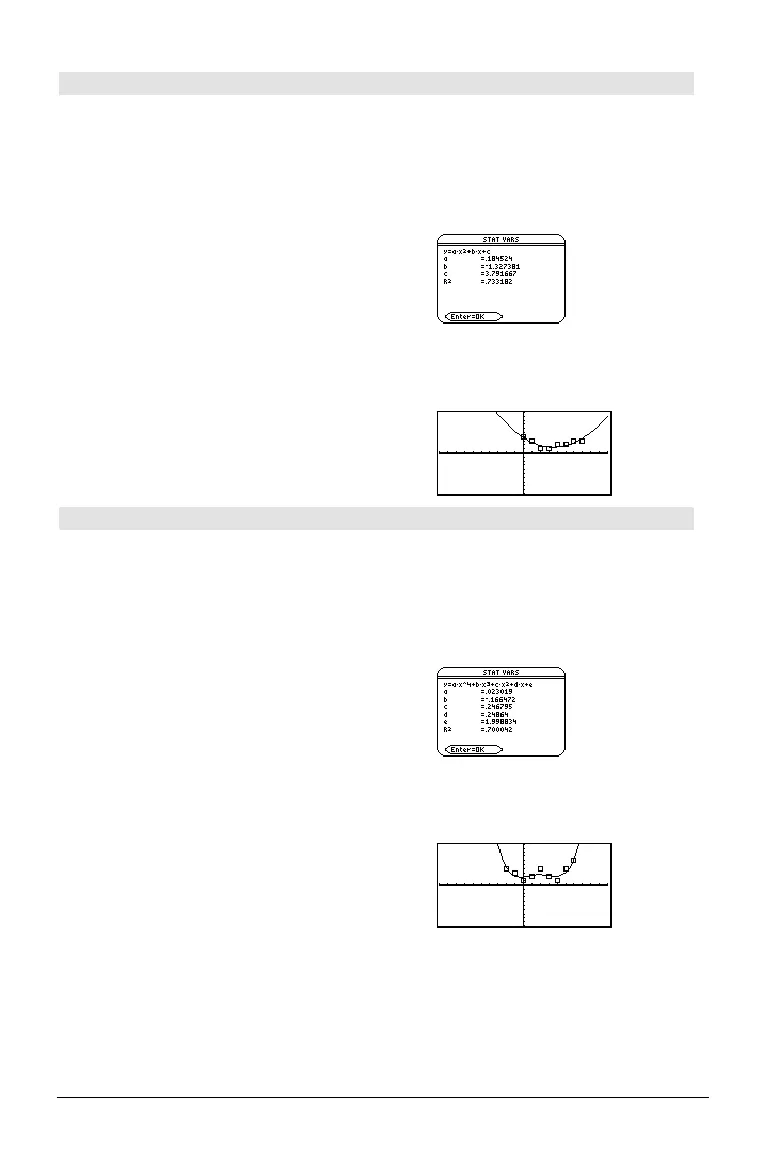
QuadReg
list1
,
list2
[, [
list3
] [,
list4
,
list5
]]
Calculates the quadratic polynomial regression
and updates the system statistics variables.
All the lists must have equal dimensions except
for
list5
.
list1
represents xlist.
list2
represents ylist.
list3
represents frequency.
list4
represents category codes.
list5
represents category include list.
In function graphing mode:
{0,1,2,3,4,5,6,7}! L1 ¸
{1 2 3
...}
{4,3,1,1,2,2,3,3}! L2
¸
{4 3 1
...}
QuadReg L1,L2
¸ Done
ShowStat
¸
Note:
list1
through
list4
must be a variable name
or c1–c99. (columns in the last data variable
shown in the Data/Matrix Editor).
list5
does not
have to be a variable name and cannot be c1–c99
.
¸
Regeq(x)"y1(x)
¸ Done
NewPlot 1,1,L1,L2
¸ Done
¥%
QuartReg MATH/Statistics/Regressions menu
QuartReg
list1
,
list2
[, [
list3
] [,
list4
,
list5
]]
Calculates the quartic polynomial regression and
updates the system statistics variables.
All the lists must have equal dimensions except
for
list5
.
list1
represents xlist.
list2
represents ylist.
list3
represents frequency.
list4
represents category codes.
list5
represents category include list.
Note:
list1
through
list4
must be a variable name
or c1–c99 (columns in the last data variable
shown in the Data/Matrix Editor).
list5
does not
have to be a variable name and cannot be c1–
c99.
In function graphing mode:
{ë 2,ë 1,0,1,2,3,4,5,6}! L1 ¸
{ë 2 ë 1 0
...}
{4,3,1,2,4,2,1,4,6}! L2
¸
{4 3 1
...}
QuartReg L1,L2
¸ Done
ShowStat
¸
¸
Regeq(x)"y1(x)
¸ Done
NewPlot 1,1,L1,L2
¸ Done
¥%
 Loading...


