262 Appendix A: Functions and Instructions
ZoomData CATALOG
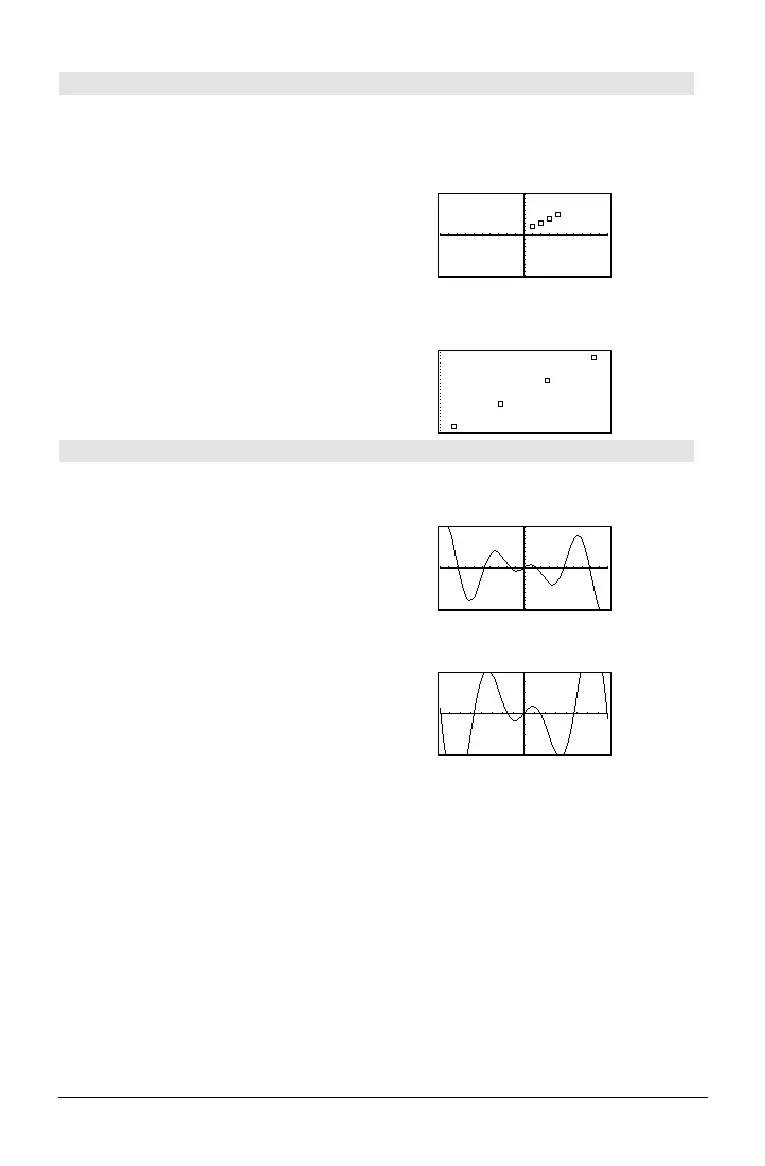
ZoomData
Adjusts the window settings based on the
currently defined plots (and data) so that all
statistical data points will be sampled, and
displays the Graph screen.
Note: Does not adjust
ymin and ymax for
histograms.
In function graphing mode:
{1,2,3,4}! L1 ¸ {1 2 3 4}
{2,3,4,5}! L2
¸ {2 3 4 5}
newPlot 1,1,L1,L2
¸ Done
ZoomStd
¸
@ "
H ¥ "
ZoomData
¸
ZoomDec CATALOG
ZoomDec
Adjusts the viewing window so that @x and
@y = 0.1 and displays the Graph screen with the
origin centered on the screen.
In function graphing mode:
1.25xù cos(x)! y1(x) ¸ Done
ZoomStd
¸
@ "
H ¥ "
ZoomDec
¸

 Loading...


