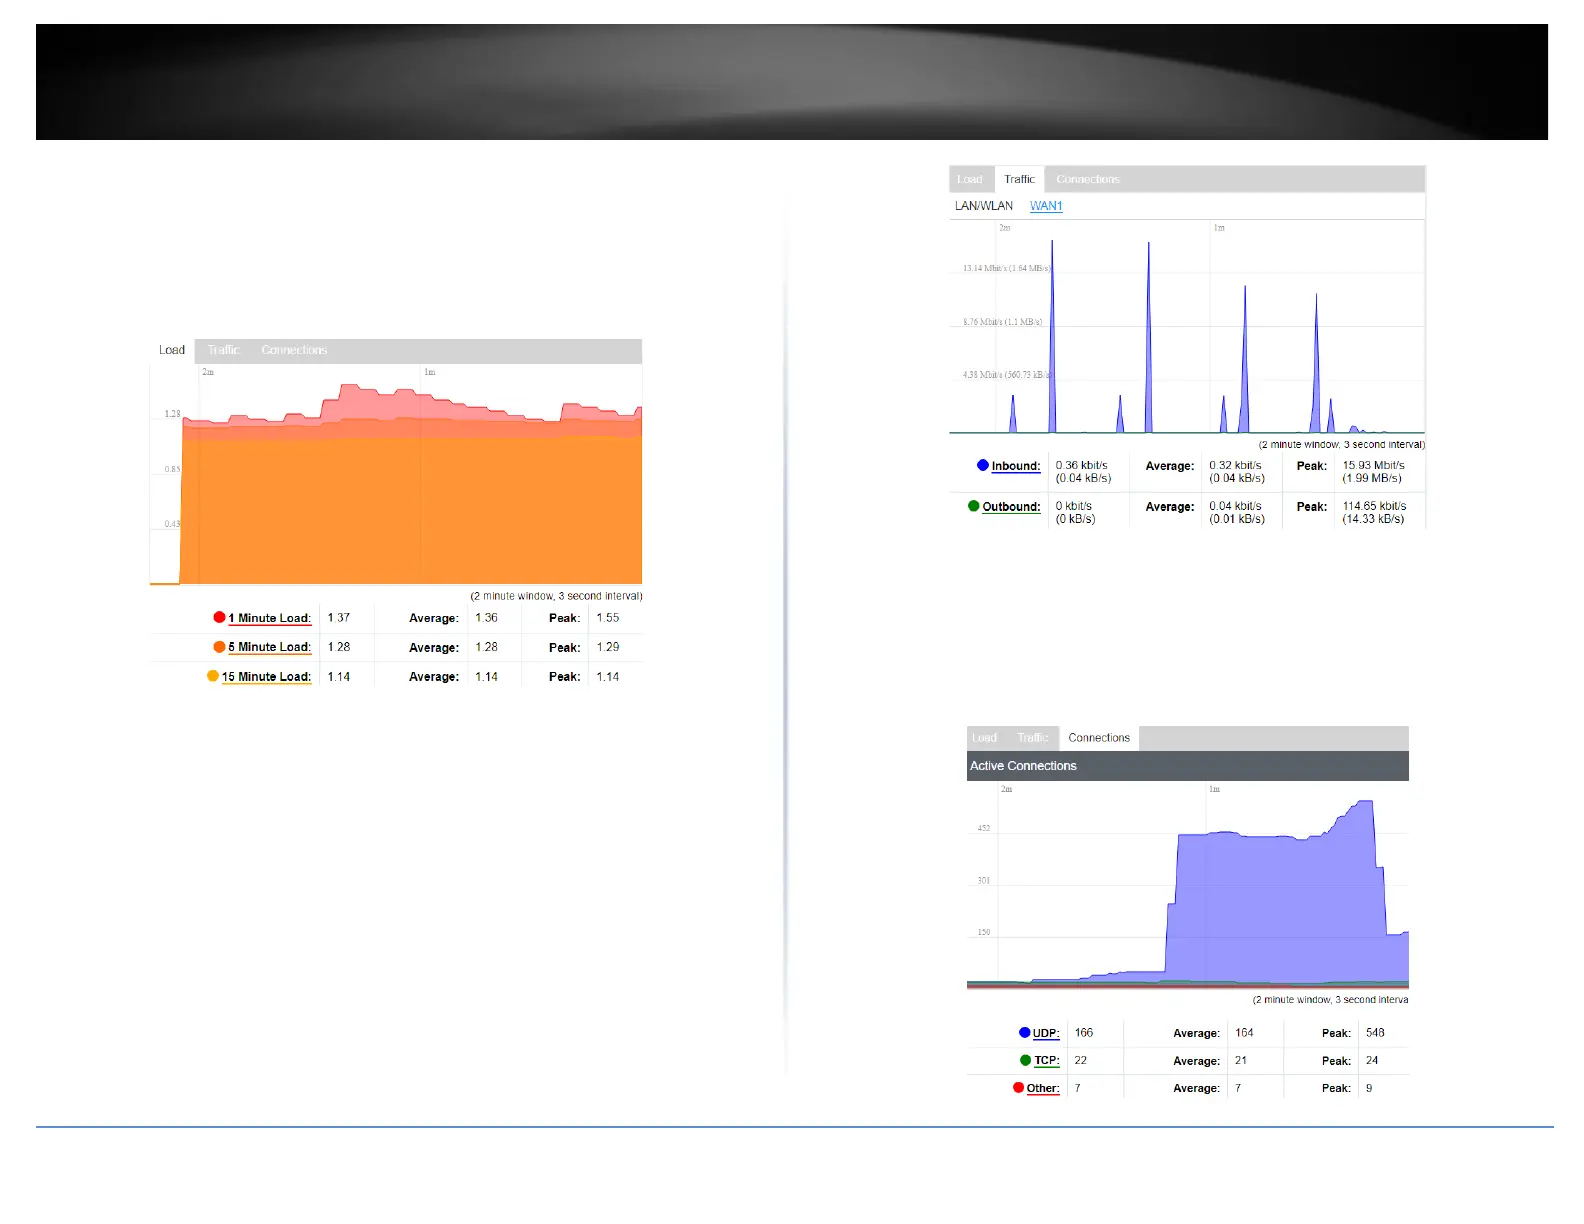
CPU Load
This chart shows the load of the CPU in 1 minute, 5 minutes, and 15 minutes intervals.
• Red graph: Displays the CPU load in the last 1 minute
• Orange graph: Displays the CPU load in the last 5 minutes
• Yellow graph: Displays the CPU load in the last 15 minutes
Traffic Load
This chart shows the real-time traffic load
• Blue graph: Displays the inbound traffic
• Green graph: Displays the outbound traffic
Traffic Load
This chart shows the connection and session information
• Blue graph: Displays the connections with UDP protocol
• Green graph: Displays the connections with TCP protocol
• Red graph: Displays the connections that do not use UDP or TCP protocol