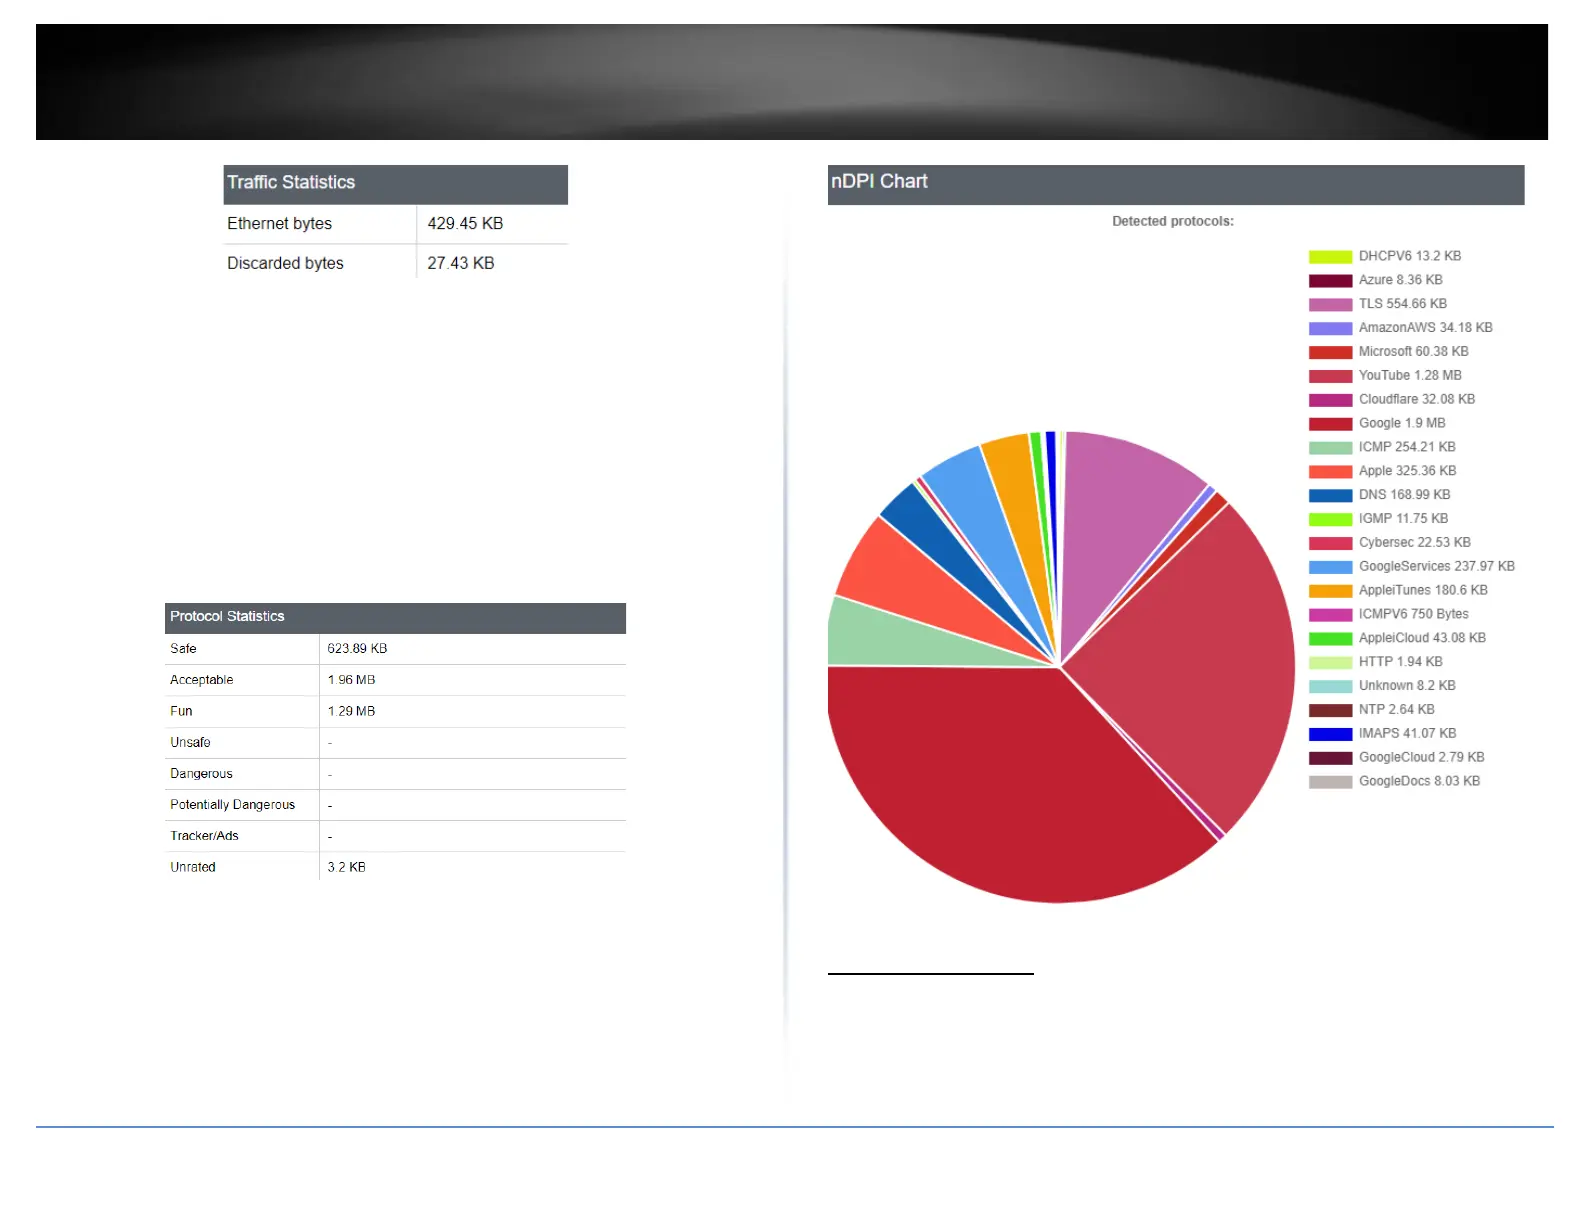
Protocol Statistics
• Safe – Displays the amount of data that was safe
• Acceptable – Displays the amount of data that was acceptable
• Fun – Displays the amount of data used for various social media, media
streaming services, gaming, and chat.
• Unsafe – Displays the amount of data that was unsafe
• Dangerous – Displays the amount of data that was dangerous
• Potentially Dangerous – Displays the amount of data that was Potentially
Dangerous
• Tracker/Ads – Displays the data that passed through were ads or trackers
• Unrated – Displays the ads that were unrated
nDPI Chart
This chart shows the break down of the types of data being processed through the
selected Network Interface, as well as the amount of data in bytes. Data is refreshed
every 15 seconds.
Real-Time Graphs
Dashboard > Real-Time Graphs
This section displays the device real-time CPU load, traffic load, and connection/session
information.