Chapter 5: Monitoring the Patient
5-6 VS2000 Vital Signs Monitor Operation Manual
d. Temperature (T1 and T2)
5.6.5 Viewing Stored Trend Data
To view the stored trend data, press the menu key and turn the rotary knob on
the monitor to move the cursor to “Review” option and push to access the
review submenu shown as below.
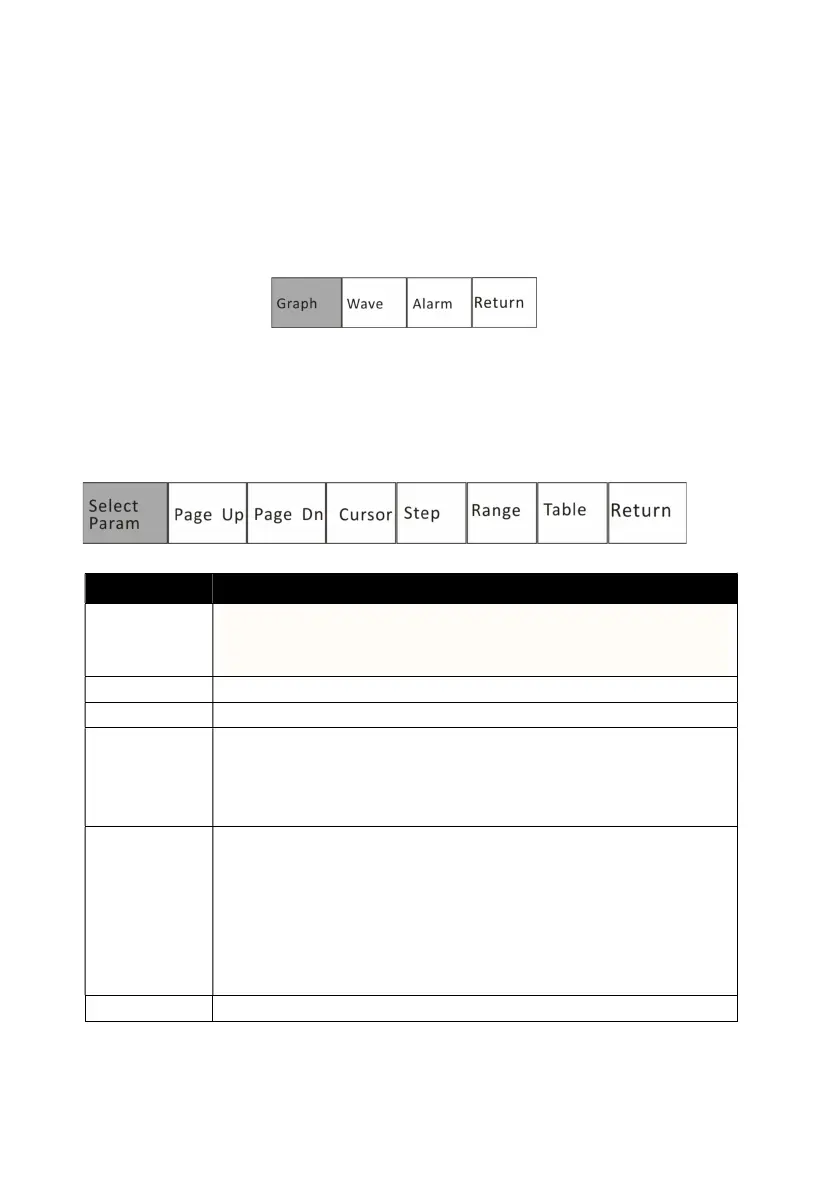
1. Review Trend Graph
In the review submenu, highlight the “Graph” and push the rotary knob to
select. The monitor will display the trend graph and the following menu.
ITEMS INSTRUCTION
Select
Parameter
Select a parameter: HR, ST, SpO
2
, NIBP, RR, or T1/T2 and push
the rotary knob to select. The corresponding trend graph will
be displayed in the trend graph display area.
Page up/ Dn Browse the time frame of the trend graph.
Cursor Use to select points on the trend graph.
Step Select the time intervals between data points. The trend
graph will be adjusted accordingly. The available time
intervals are 1 second, 5 seconds, 10 seconds, 20 seconds, 30
seconds, 60 seconds, 90 seconds and 120 seconds.
Range It is used to designate the Y axis value range of the trend
graph. The adjusted range will be stored in the monitor and
will be applied when the monitor restarts. The range has
three adjustment modes: alarm limit range, maximum range,
and manual adjustment. Once the user sets the range, the
trend graph displays data within the upper limit/lower limit
alue over the limit is not valid.
Table Select this option to access the trend table display.
2. Review Trend Table