77
Vertiv I Liebert LPC I User Manual
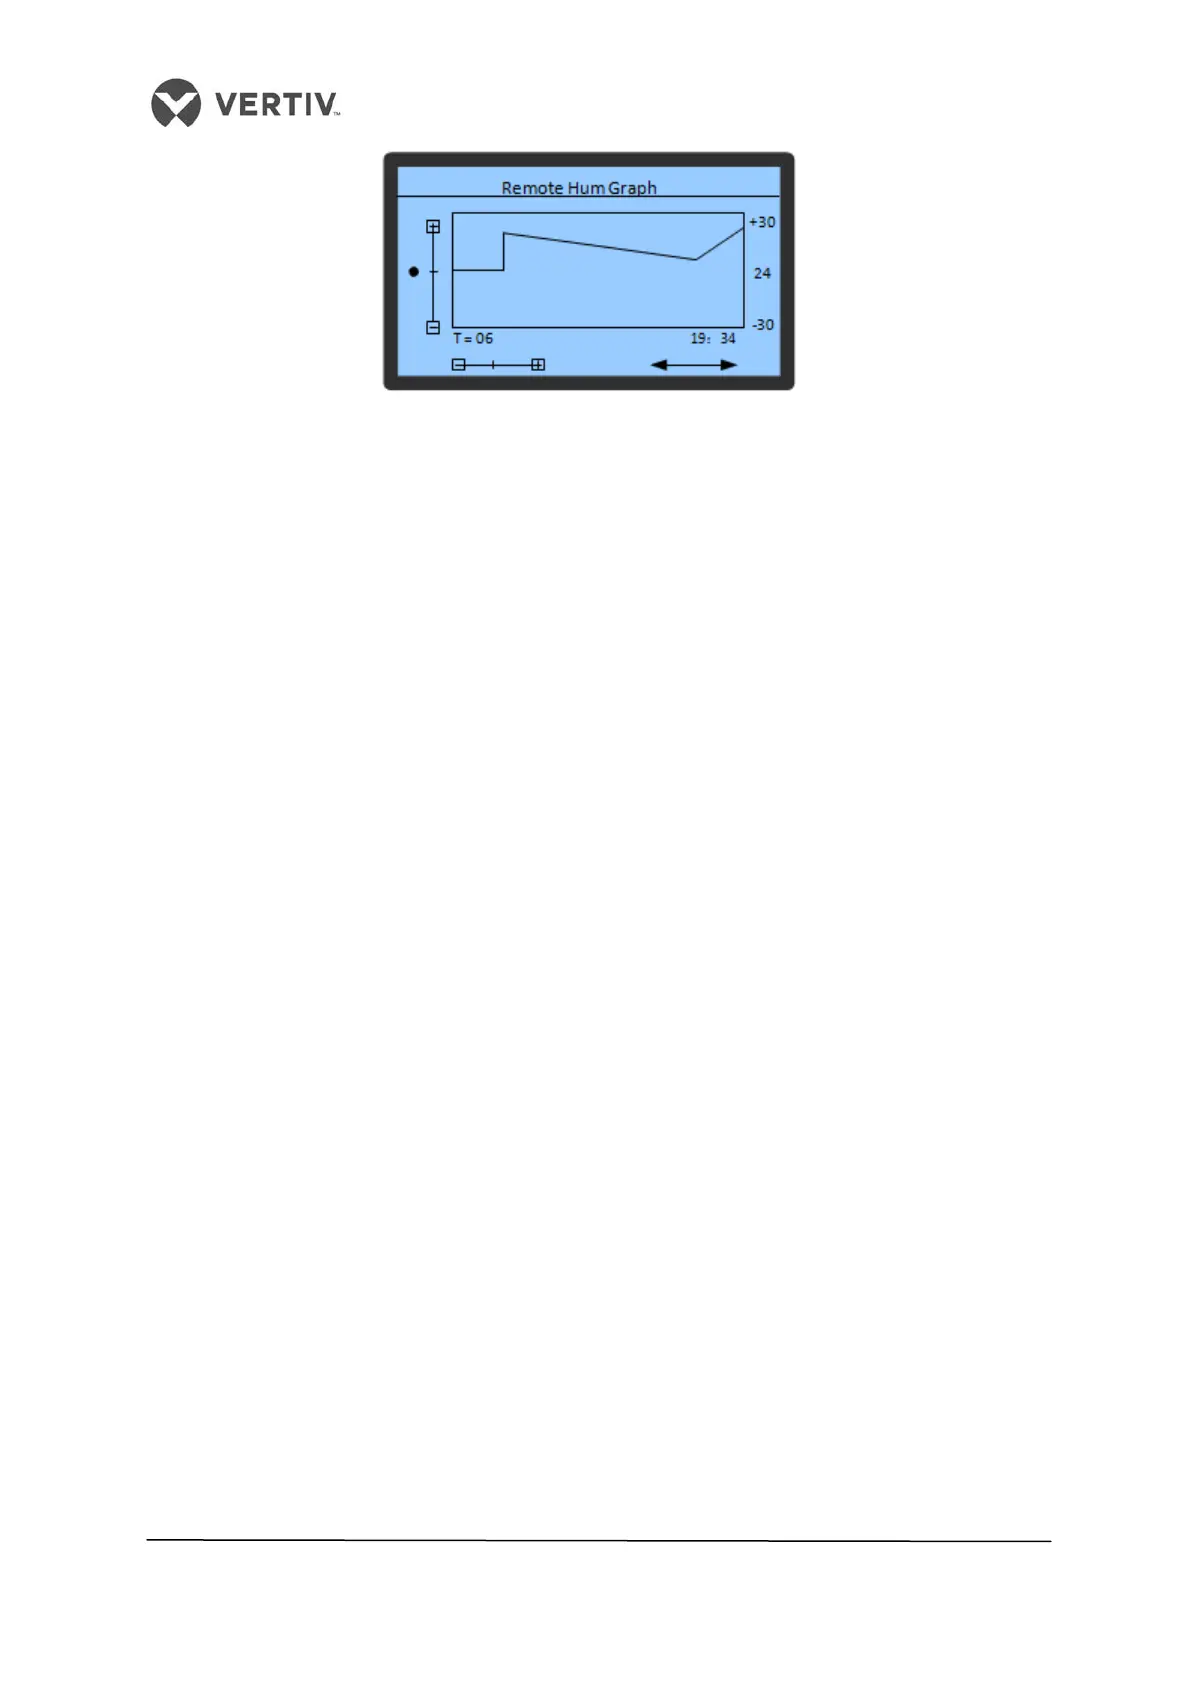
Figure 4-23 Humidity Graph
In the graph, the current humidity is the origin, time is the horizontal axis, and humidity is the
vertical axis. The graph displays the humidity changes from 6h to 48h through the zooming
operation and controlling cursor movement. Press the Up or Down key to move the cursor to
the required zoom-control bar. Press the Enter key to enter the editing mode and zoom in or
zoom out the graph using the Up and Down key.
The following is a brief overview of the Remote Monitoring Mode:
The Liebert LPC humidity air conditioners support the multiple monitoring modes:
• Connecting the RDU and SiteWeb - A monitoring system developed by Vertiv Co.
Alternatively, A third-party monitoring system can be used in compliance with the
standard protocol of the Ministry of Industry and Information technology.
• Connecting RDU and SiteWeb- a monitoring system developed by Vertiv Co. or any
third-party application via the Modbus- RTU protocol.
• Connecting the network management software using the SIC card and the SNMP
protocol
The communication cables of the remote monitoring system are connected to the #77 and
#78 terminals in the electric control box. Refer to the Appendix section for the Circuit
Diagram to understand it better.
 Loading...