76
Vertiv I Liebert LPC I User Manual
4.9
Temperature and Humidity graph
On the main interface (2/2), move the cursor using the Up or Down key to the Temperature
and Humidity Graph menu. Through the menu, browse and view the temperature as well as
the Humidity graphs. These graphs reflect the change in temperature and humidity over an
earlier time period.
Figure 4-21 shows the Temperature/Humidity Graph menu:
Figure 4-21 Temperature and Humidity Graph menu
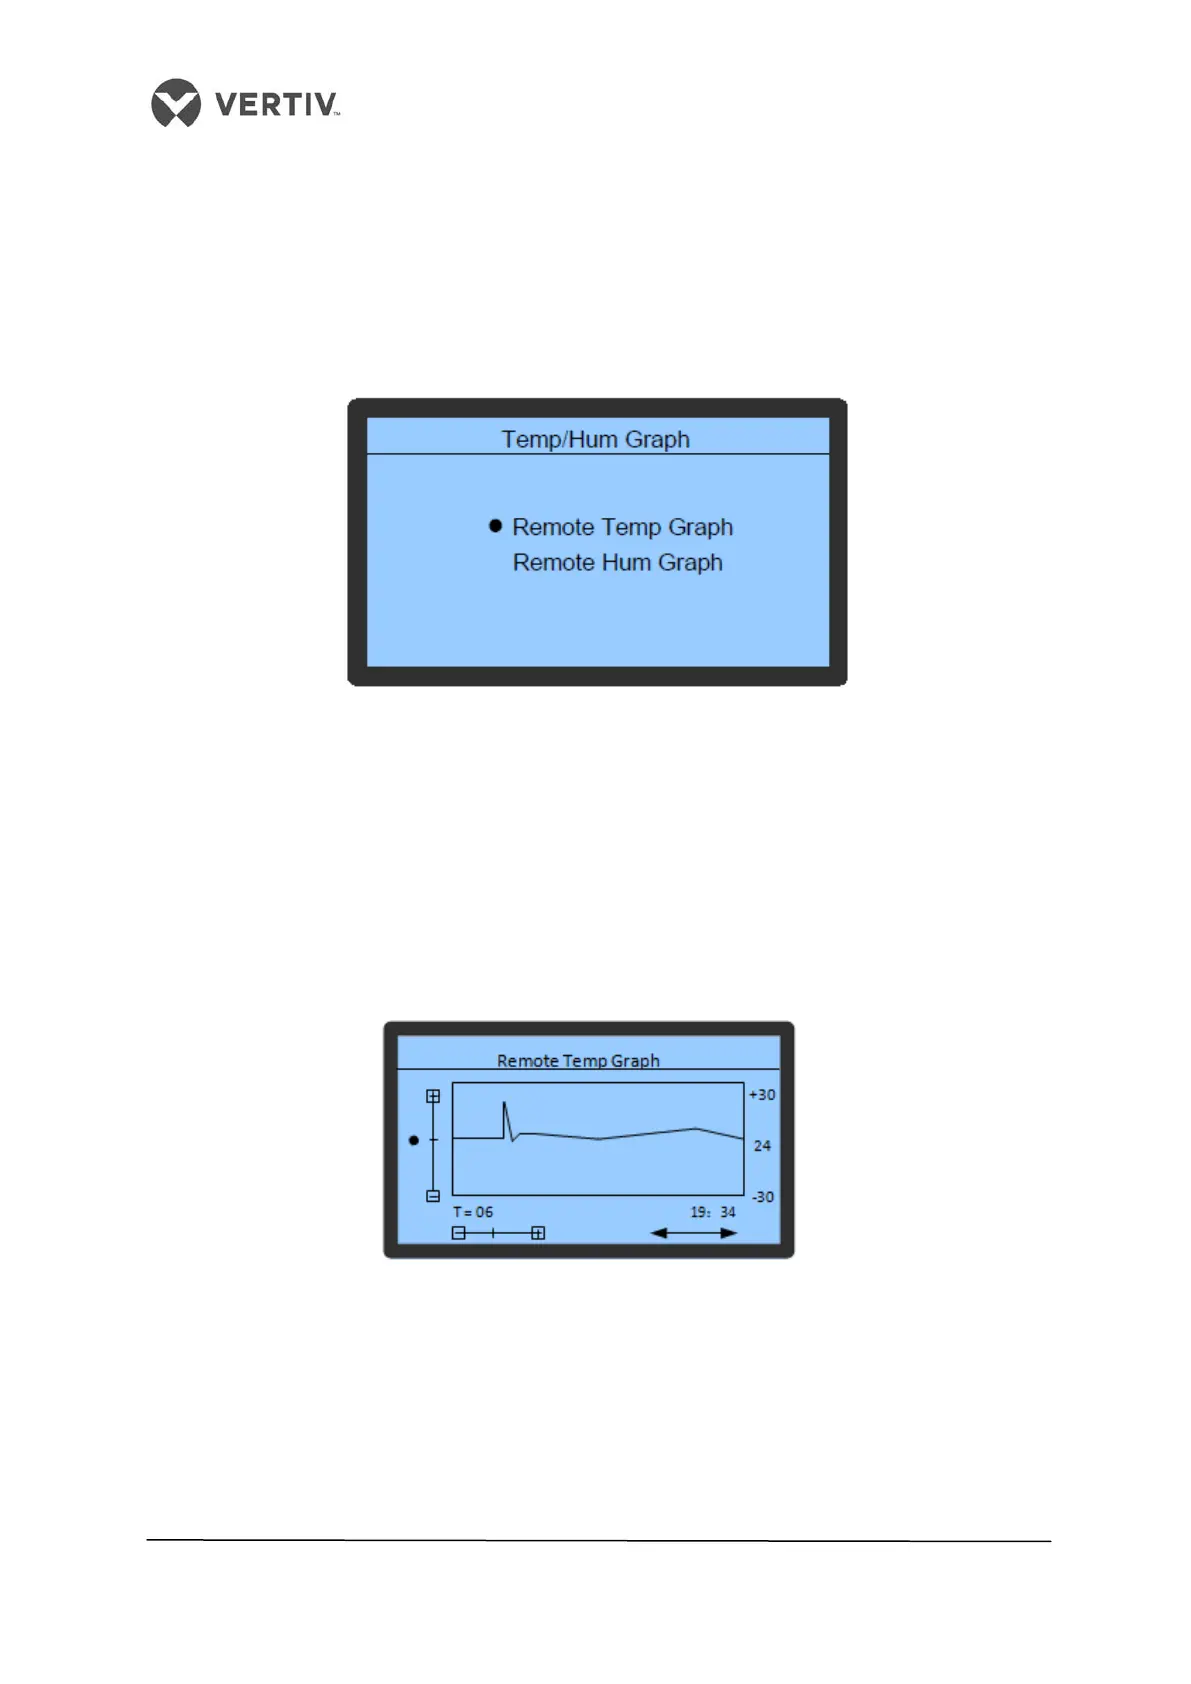
In the first option, click on the Remote Temp Graph options to access the Temperature sub-
menu as depicted in Figure 4-22. In the graph, the current temperature is the origin, time is
the horizontal axis, and temperature is the vertical axis. The graph displays the temperature
changes from 6h to 48h through the zooming operation and controlling cursor movement.
Press the Up and Down key to move the cursor to the required zoom-control bar. Press the
Enter key to enter the editing mode and zoom in or zoom out the graph using the Up and
Down key.
Figure 4-22 Temperature Graph
Back to the Temperature and Humidity Graph menu interface, choose the Hum Graph menu.
 Loading...