General Operation
VTM-2000 Installation and Operation Handbook
3-30
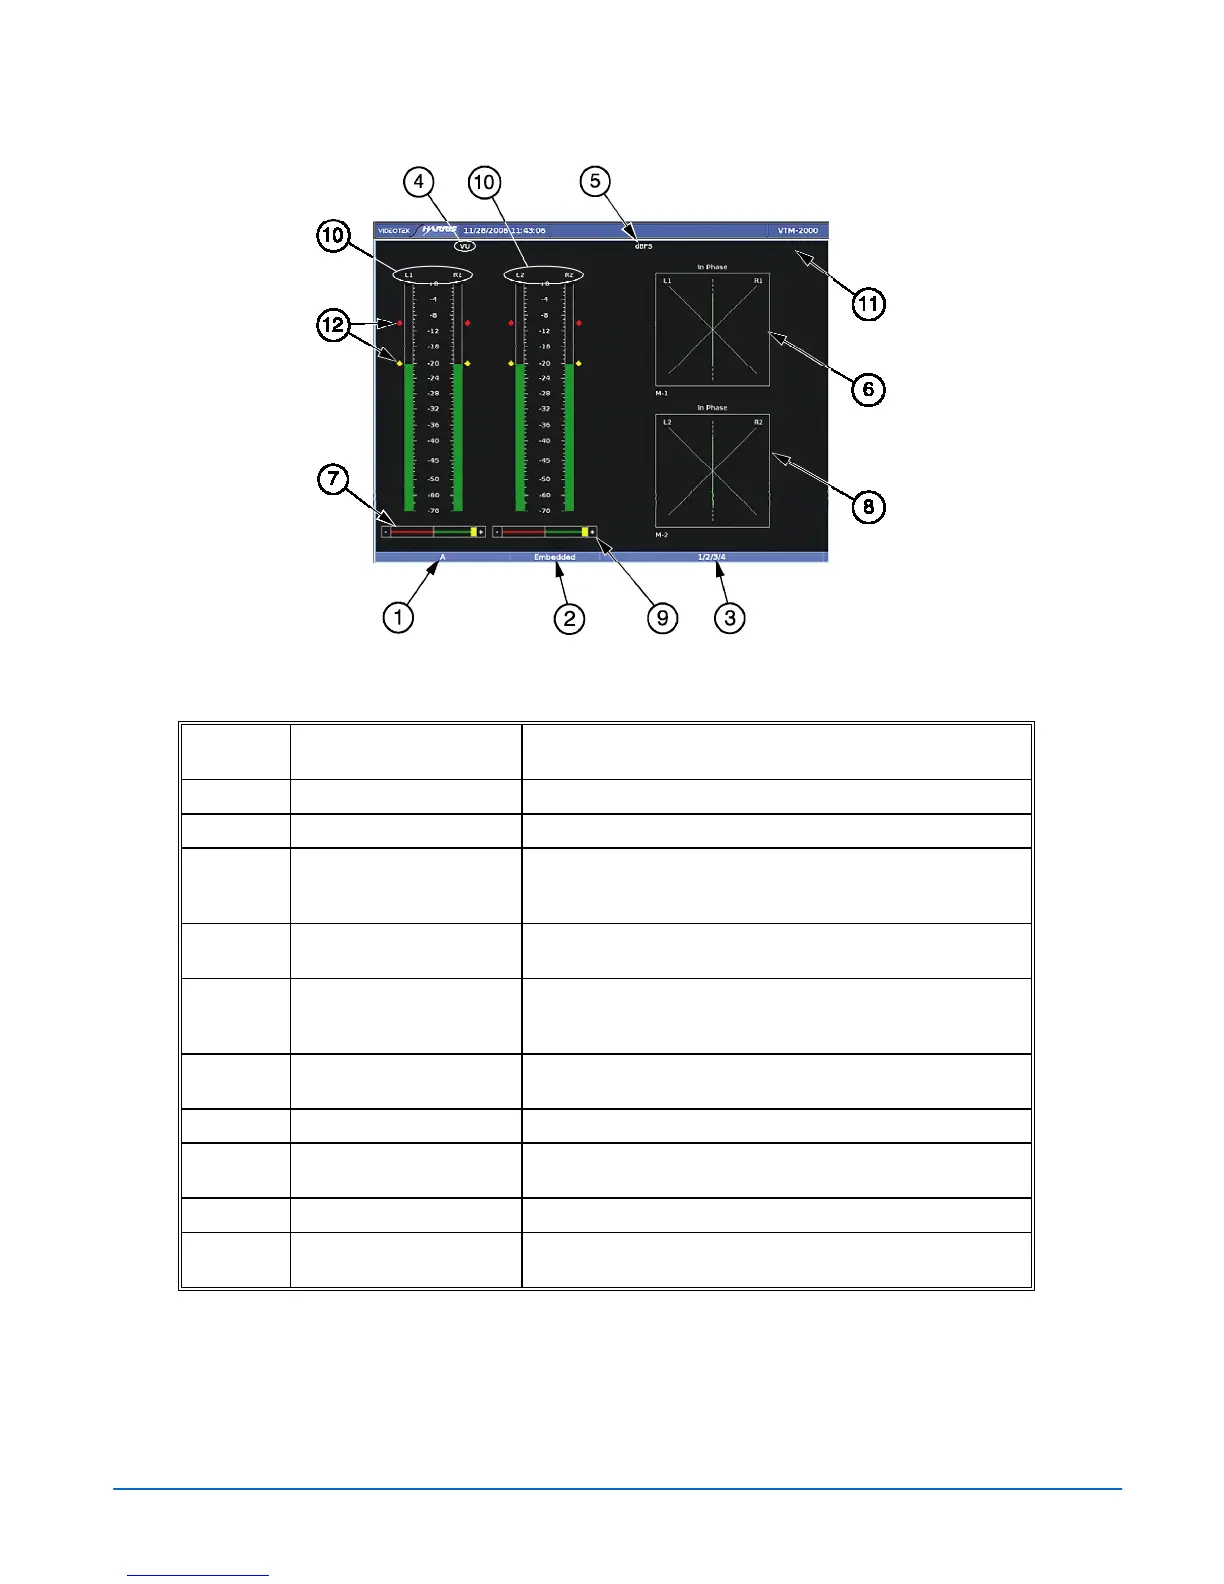
Figure 3-27. Four Bar Graph with Lissajous Display Diagram
Table 3-16. Description of Four Bar Graph with Lissajous Display Diagram
Field
Identifier
Field information
Nomenclature
1
Input Displays the video input associated with the audio.
2
Audio Type Displayed as Analog, AES/EBU, or Embedded
3
Audio Input Monitored Audio channels that are associated with the
meters. Shown as 1 to 16 (analog is 1 to 4, AES is 1 to 8,
and Embedded is 1 to 16).
4
Meter Response Displays the selected meter response: VU, Peak, True Peak,
VU + Peak, VU + True Peak
5
Scale Selection Displays the selected meter scale: Type I, Type IIa, Type IIb,
Type I + 8, Nordic, DIN 45406, dBFS, Zero REF dBFS
(scales dependent upon audio type).
6
Lissajous Display (1) Lissajous of bar graph 1 with labels for R, L, and the number
of the meter being monitored (i.e. M-1)
7
Phase Bar (1) Phase Meter of bar graph 1
8
Lissajous Display (2) Lissajous of bar graph 1 with labels for R, L, and the number
of the meter being monitored (i.e. M-2)
9
Phase Bar (2) Phase Meter of bar graph 2
10
Audio Graticule (with
meter labels)
Shown as L1, R1, L2, and R2.
(Table continues on next page)