258 7 Maintenance
3. Starting from the [•] mark on the chart, slide the chart upwards and downwards, and
read the scale to determined the difference (margin) between the scale and the Color
Sample.
Important
• Be careful not to mistake the plus (+) and minus (-) directions when reading the scale.
4. Write the margin value in the appropriate [Margin] box.
5. Obtain the margin for two other density areas.
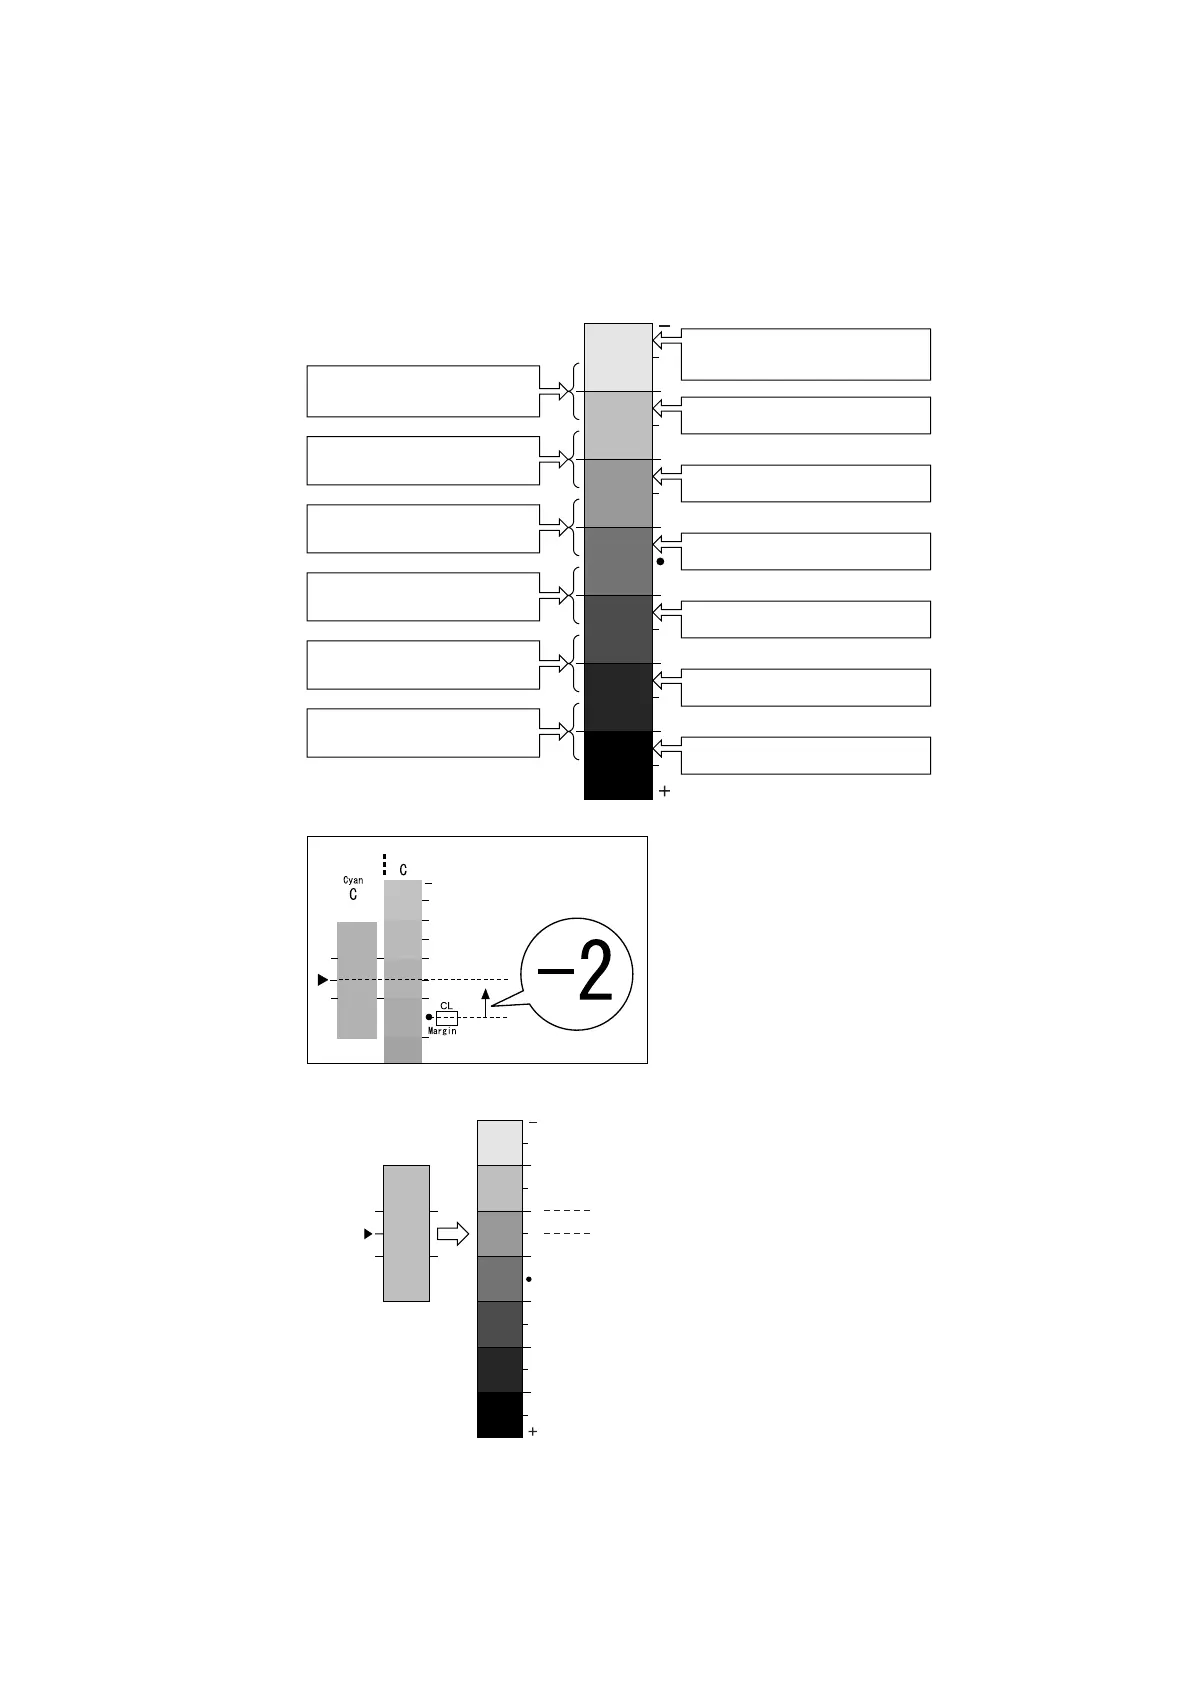
Measurement part of Calibration Chart
<-5> if density of Color Sample
is close the density in-between.
<-3> if it is close the density
in-between.
<-1> if it is close the density
in-between.
<+1> if it is close the density
in-between.
<+3> if it is close the density
in-between.
<+5> if it is close the density
in-between.
<-6> if density of Color Sample is
close the density here.
<-4> if it is close the density here.
<-2> if it is close the density here.
<0> if it is close the density here.
<+2> if it is close the density here.
<+4> if it is close the density here.
<+6> if it is close the density here.
Color Sample
"-2"
"-1"
For the example on the left, density of the
Calibration Chart close to the Color Sample
is at the second position in the negative
direction from the central position or density
A, therefore, the difference is <-2>.
A