1-27
IM 04L51B01-01EN
Configuring the GX/GP
1
Bar graph
Setup Item Selectable Range or Options Default Value
Base position Lower, Center, Upper Lower
Division 4, 5, 6, 7, 8, 9, 10, 11, 12 10
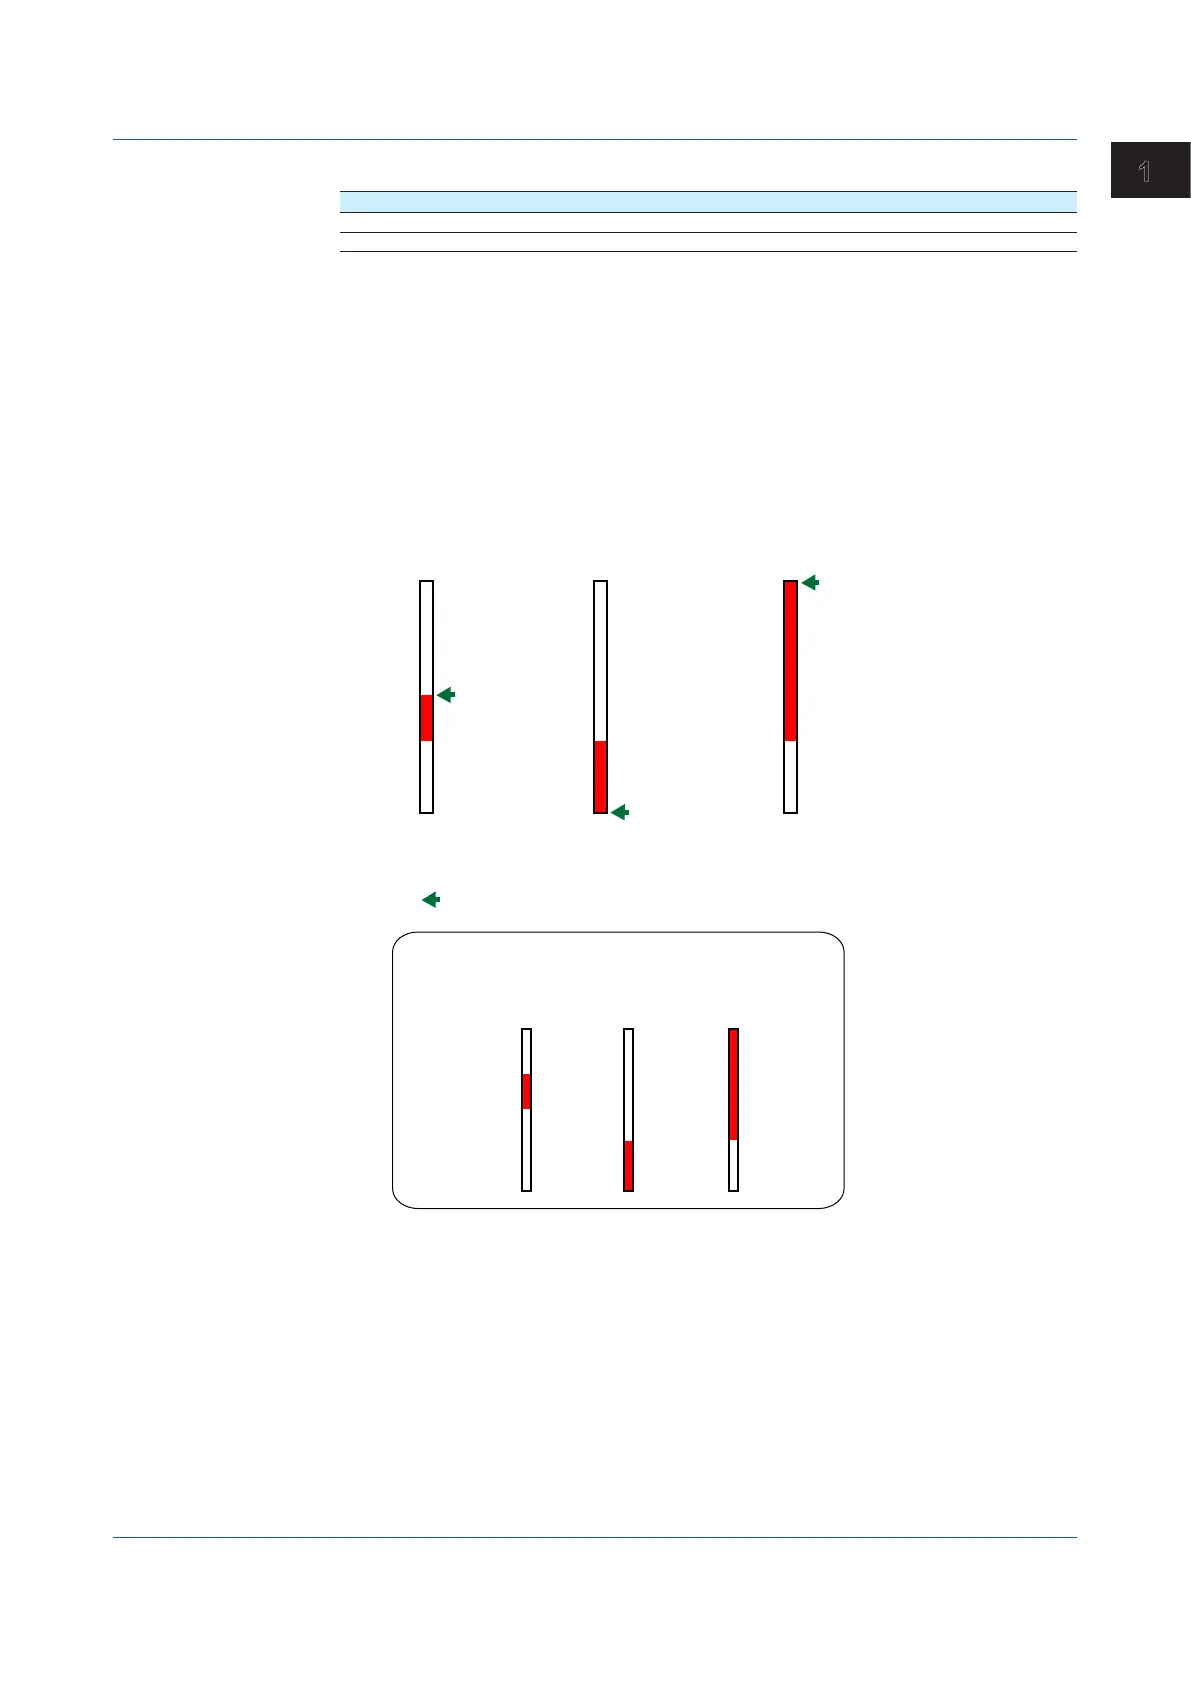
Base position
Set the bar graph base position. Depending on the setting, the bar graph is displayed as
follows. This setting is applied on the bar graph display and when you are displaying the
current value on the scale as a bar graph on the trend displays.
When the Display Direction of the Bar Graph Is Vertical
The span lower limit (or scale lower limit) is at the bottom edge of the bar graph, and the
span upper limit (or scale upper limit) is at the top edge of the bar graph.
Starting point of the bar
Center: Center
Lower: Bottom edge
Upper: Top edge
Vupper: Span upper limit (or scale upper limit)
Vlower: Span lower limit (or scale lower limit)
: Starting point of the bar
Center
–100.0
0.0
Lower
–100.0
0.0
Upper
–100.0
0.0
Example: When the span lower and upper limits of the input
range are 0.0 and –100.0, respectively
V
lower
V
lower
V
upper
V
lower
V
upper
upper
1.2ConfiguringAIChannels(Analog(includingDI)input)channelsandAI(mA)channels
 Loading...