Manual Power Quality Filter PQFM The PQF-Manager user interface 169
L1
K L
X21.2
X21.3
X21.4
X21.5
X21.6
X21.7
X21.8
X21.9
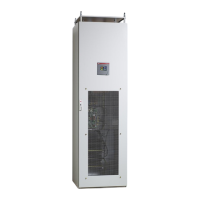
Figure 93: Connection of the scopemeter for checking the CT in phase L1
On the scopemeter screen, two waveforms should appear. The voltage waveform should
be approximately a sine wave and the current waveform would normally be a well-
distorted wave because of harmonic distortion. Usually, it is quite easy to extrapolate
the fundamental component as it is the most important one (Figure 94).
Remark: If the earthing of the system is bad, the phase to ground voltage may appear
like a much distorted waveform. In this case, it is better to measure the phase-to-phase
voltage (move the black clamp to the phase L2) and subtract 30° on the measured phase
shift.
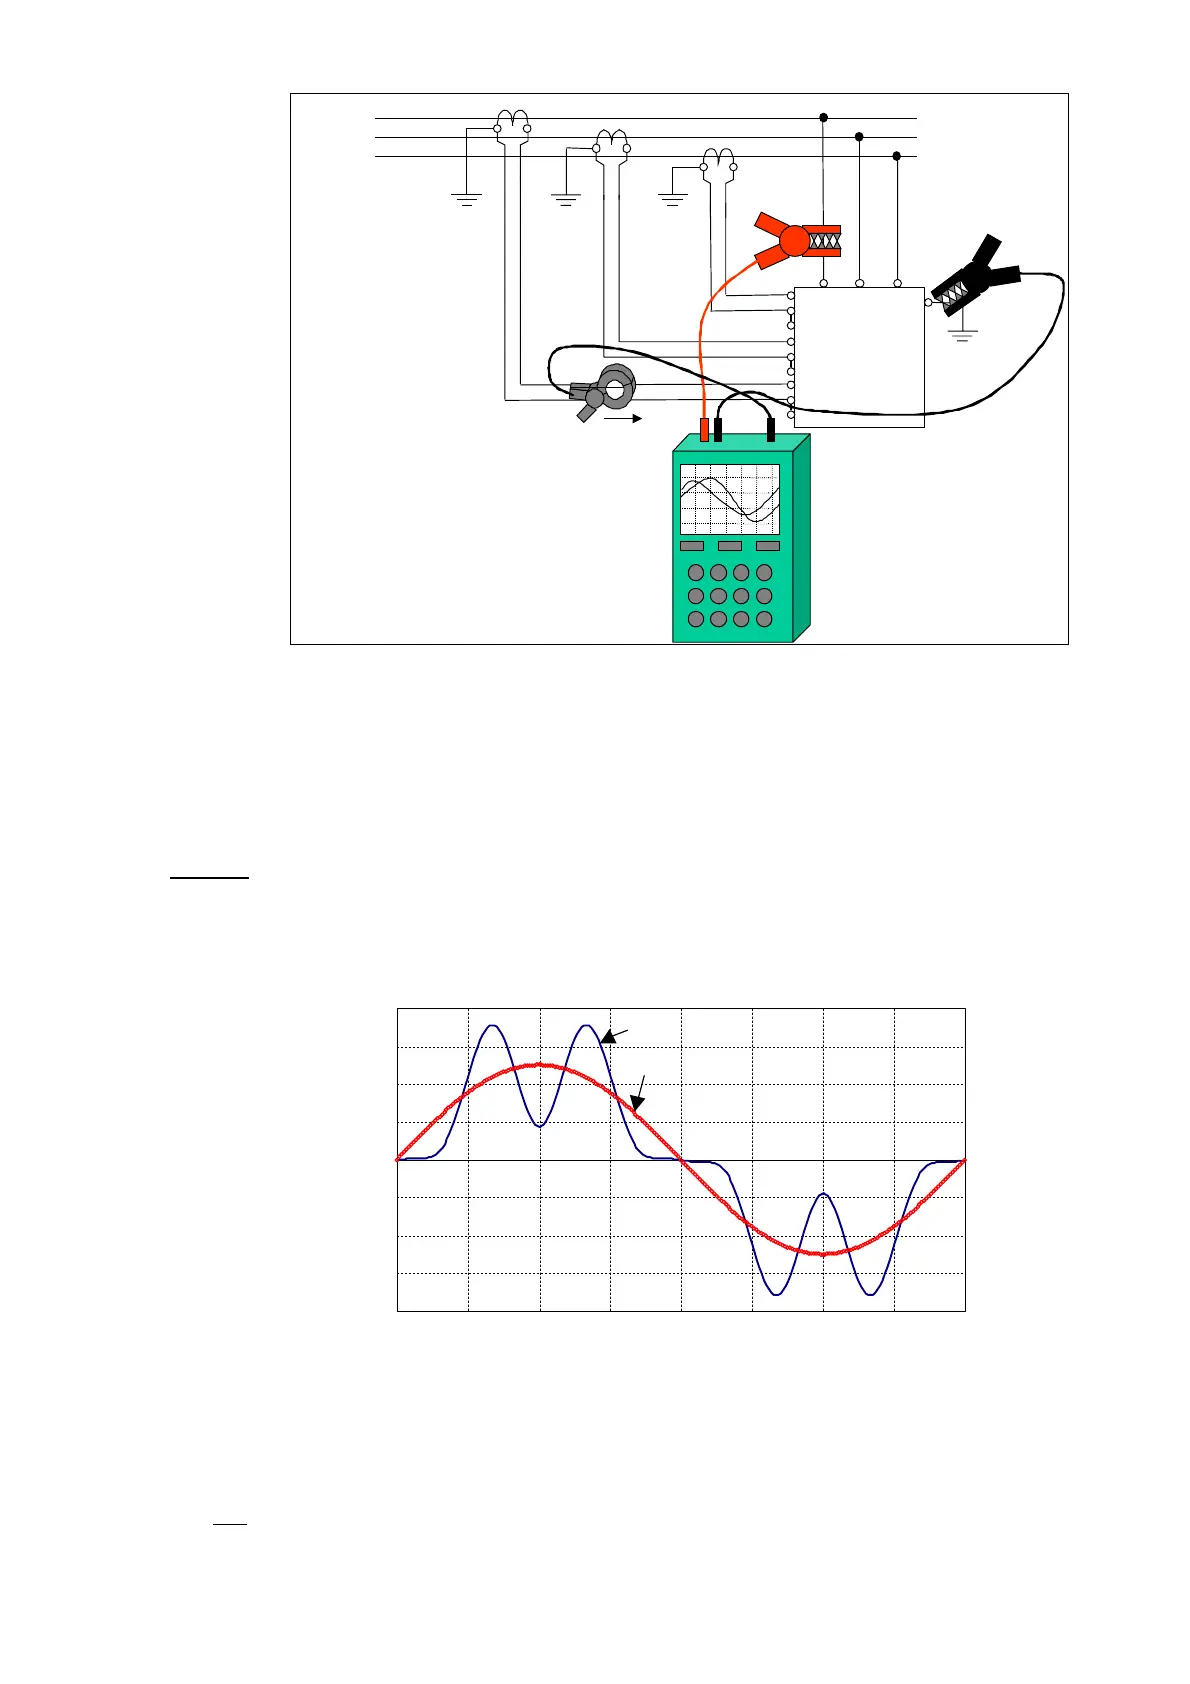
Figure 94: Extrapolation of the fundamental component from a distorted waveform
From the fundamental component of both signals, the phase shift must then be
evaluated (Figure 95).The time ∆T between zero crossing of the rising (falling) edge of
both traces must be measured and converted to a phase shift ϕ by the following formula:
°∗
= 360
T
ϕ
where T1 is the fundamental period duration.
I
I1