Chapter 5 Analyze the Relative Standard Curve Experiment
View the Standard Curve
83
Applied Biosystems 7500/7500 Fast Real-Time PCR System Getting Started Guide for Relative Standard Curve
and Comparative C
T
Experiments
Notes
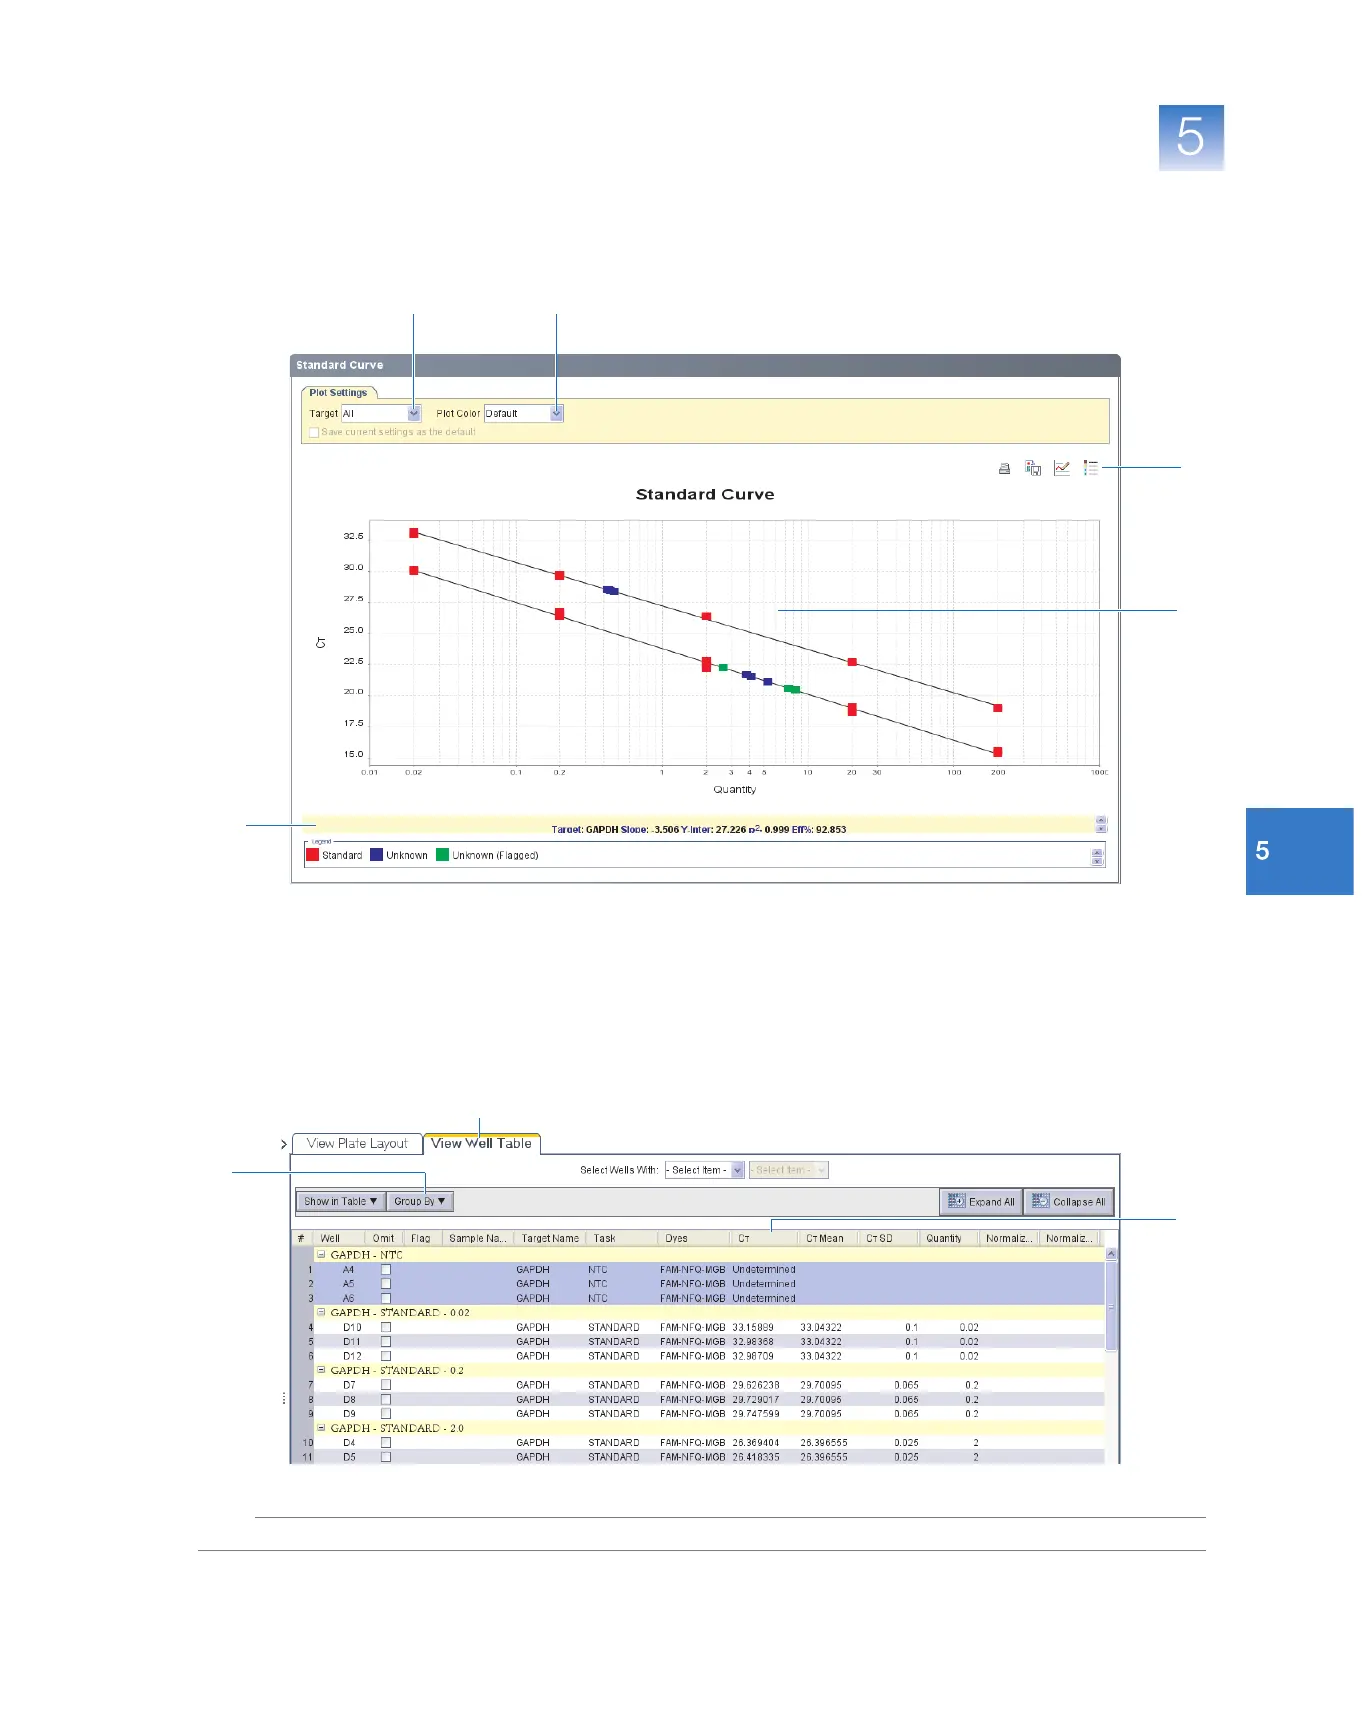
7. Check that all samples are within the standard curve. In the example experiment, all
samples (blue dots) are within the standard curve (red dots).
8. Check the C
T
values:
a. Select the View Well Table tab.
b. In the Group By drop-down list, select Replicate.
c. Look at the values in the C
T
column. In the example experiment, the C
T
values
are within the expected range (>8 and <35).
6
3
4
5
7
8b
8a
8c