Chapter 9 Analyze the Comparative C
T
Experiment
View the Gene Expression Plot and Well Table
Applied Biosystems 7500/7500 Fast Real-Time PCR System Getting Started Guide for Relative Standard Curve
and Comparative C
T
Experiments
162
Notes
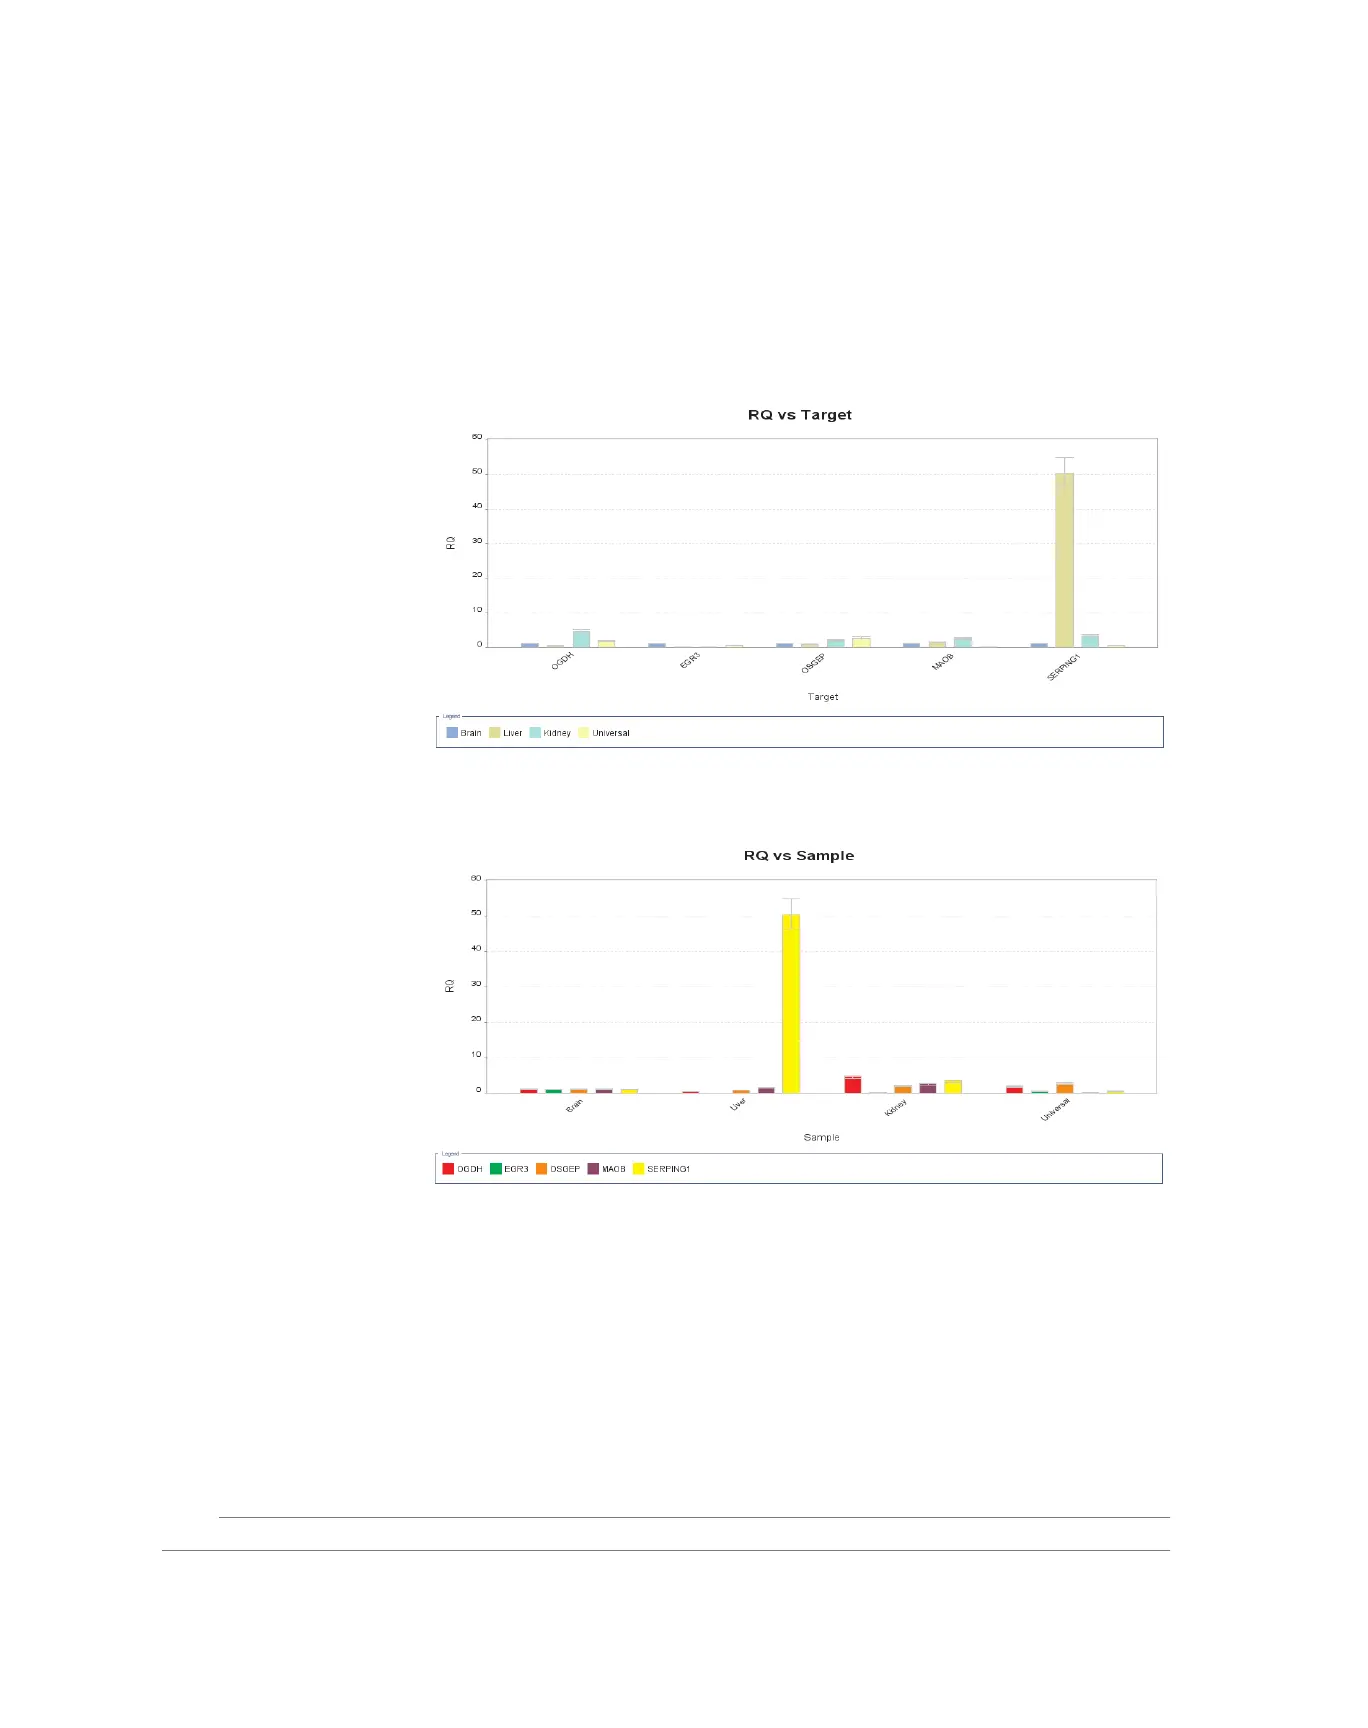
View the Gene Expression Plot and Well Table
Displays the results of relative quantitation calculations in the gene expression profile.
Two plots are available:
• RQ vs Target – Groups the relative quantitation (RQ) values by target. Each sample
is plotted for each target.
You can display the plot on a linear, log10, Ln, or log2 scale
.
•
RQ vs Sample
– Groups the relative quantitation (RQ) values by sample. Each target
is plotted for each sample.You can display the plot on a linear, log10, Ln, or log2 scale.
The Well Table displays data for each well in the reaction plate, including:
• The sample name, target name, task, and dyes
• The calculated threshold cycle (C
T
), normalized fluorescence (Rn), and quantity values
•Flags
About the
Example
Experiment
In the comparative C
T
example experiment, you review:
• Each target in the Gene Expression Plot screen for the expression level (or fold
change) of the target sample relative to the reference sample.
• The Well Table to evaluate the precision of the replicate groups.