Chapter 2 Design the Relative Standard Curve Experiment
Set Up the Relative Quantitation Settings
Applied Biosystems 7500/7500 Fast Real-Time PCR System Getting Started Guide for Relative Standard Curve
and Comparative C
T
Experiments
34
Notes
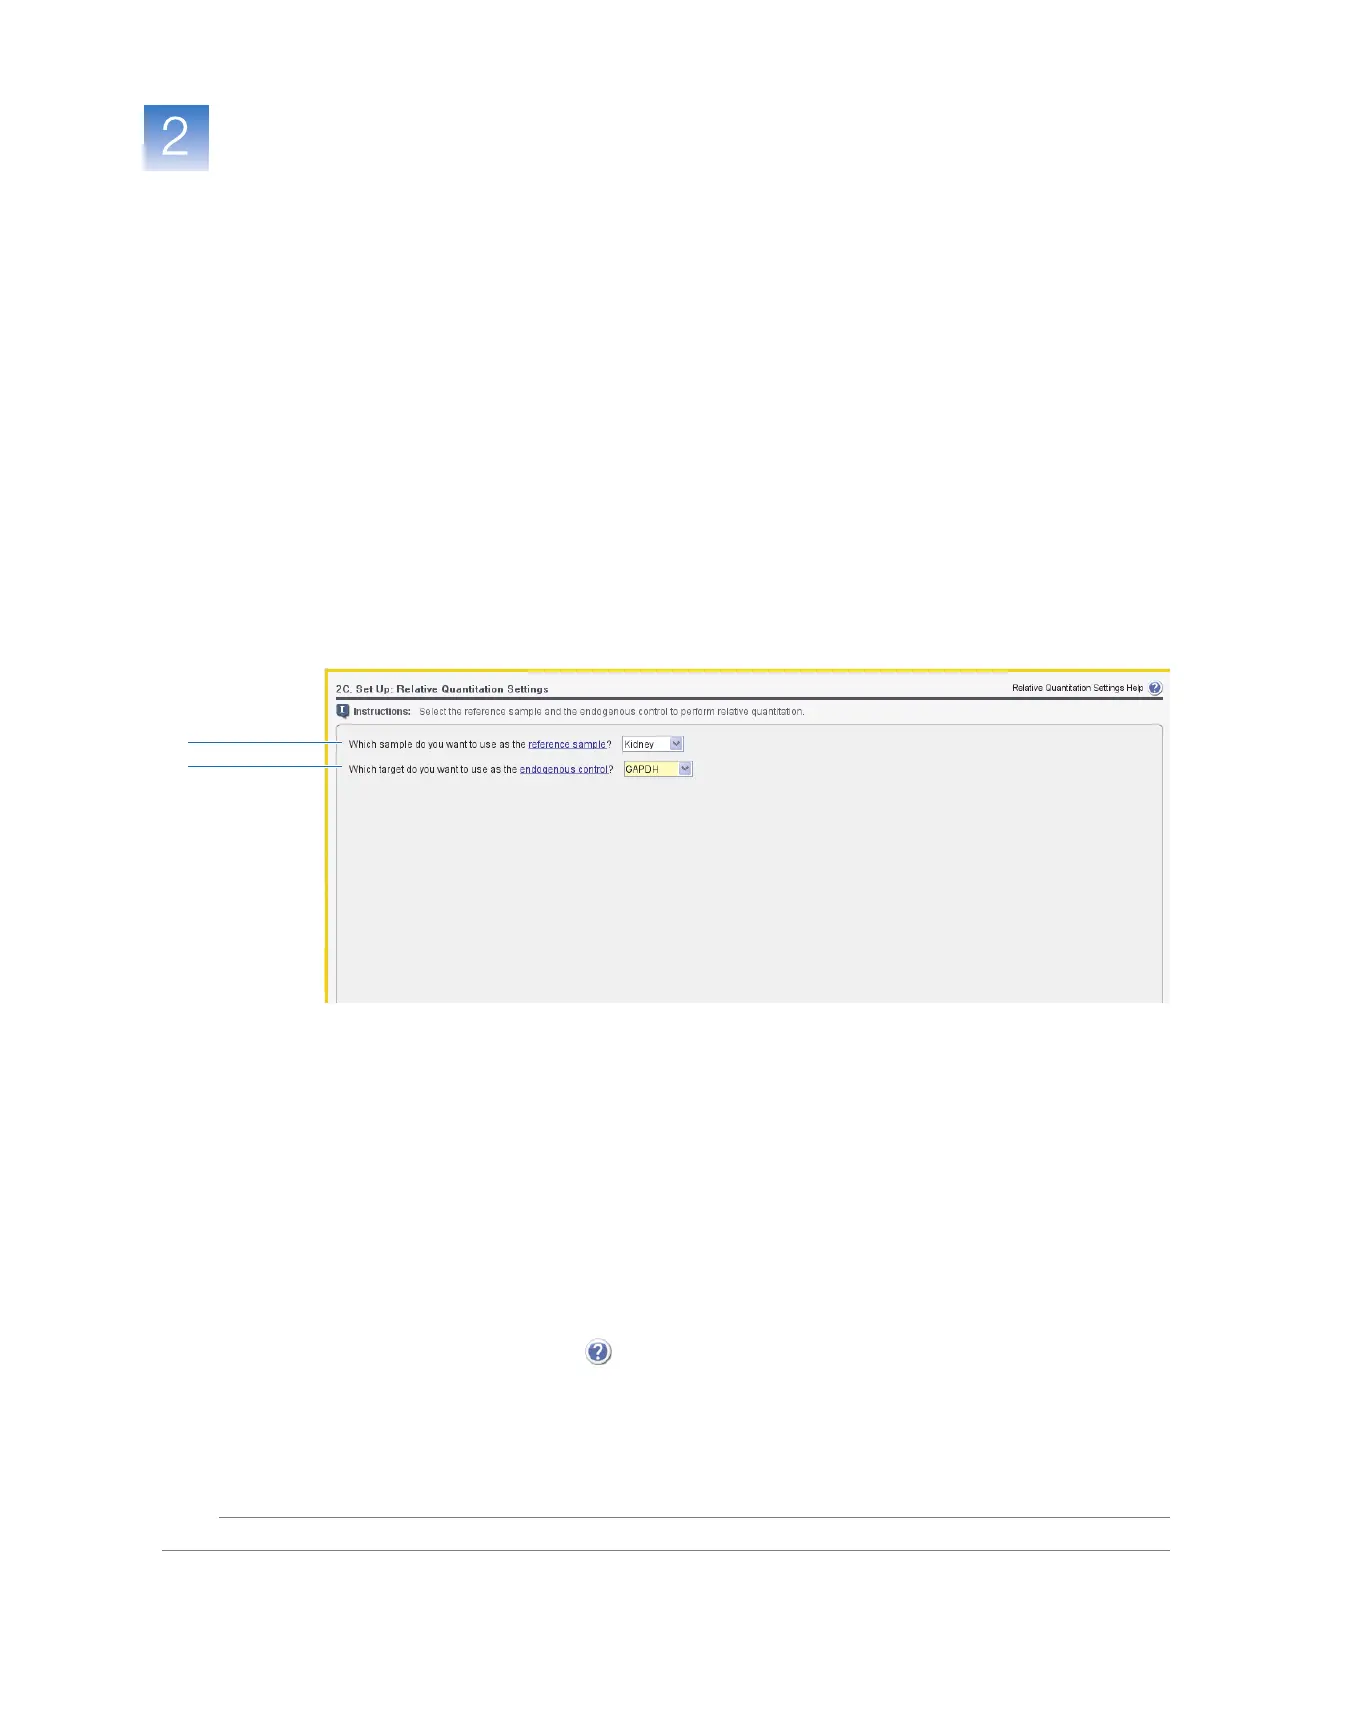
Set Up the Relative Quantitation Settings
In the Relative Quantitation Settings screen, select the reference sample and the
endogenous control to perform relative quantitation.
About the
Example
Experiment
In the relative standard curve example experiment:
• Kidney is used as the reference sample.
• GAPDH is used as the endogenous control.
Complete the
Relative
Quantitation
Settings Screen
1. In the Relative Quantitation Settings screen, select Kidney in the Which sample do
you want to use as the reference sample? drop-down list.
2. Select GAPDH in the Which target do you want to use as the endogenous control?
drop-down list.
3. Click Next.
Design
Guidelines
When you design your own relative standard curve experiment:
• Select a reference sample from your previously created samples (“Set Up the
Samples” on page 31). Amplification results from the samples are compared to the
amplification results from the reference sample to determine relative expression.
• Select an endogenous control from your previously created target assays (“Set Up
the Targets” on page 26). Amplification results from the endogenous control are
used to normalize the amplification results from the target for differences in the
amount of template added to each reaction.
For More
Information
For more information on:
• Completing the Relative Quantitation Settings screen – Open the 7500 Software
Help by clicking or pressing F1.
• Reference samples (also known as calibrators) and endogenous controls – Refer to
User Bulletin #2: Relative Quantitation of Gene Expression (PN 4303859B).
1
2