Chapter 5 Analyze the Relative Standard Curve Experiment
View the Gene Expression Plot and Well Table
93
Applied Biosystems 7500/7500 Fast Real-Time PCR System Getting Started Guide for Relative Standard Curve
and Comparative C
T
Experiments
Notes
View the Gene Expression Plot and Well Table
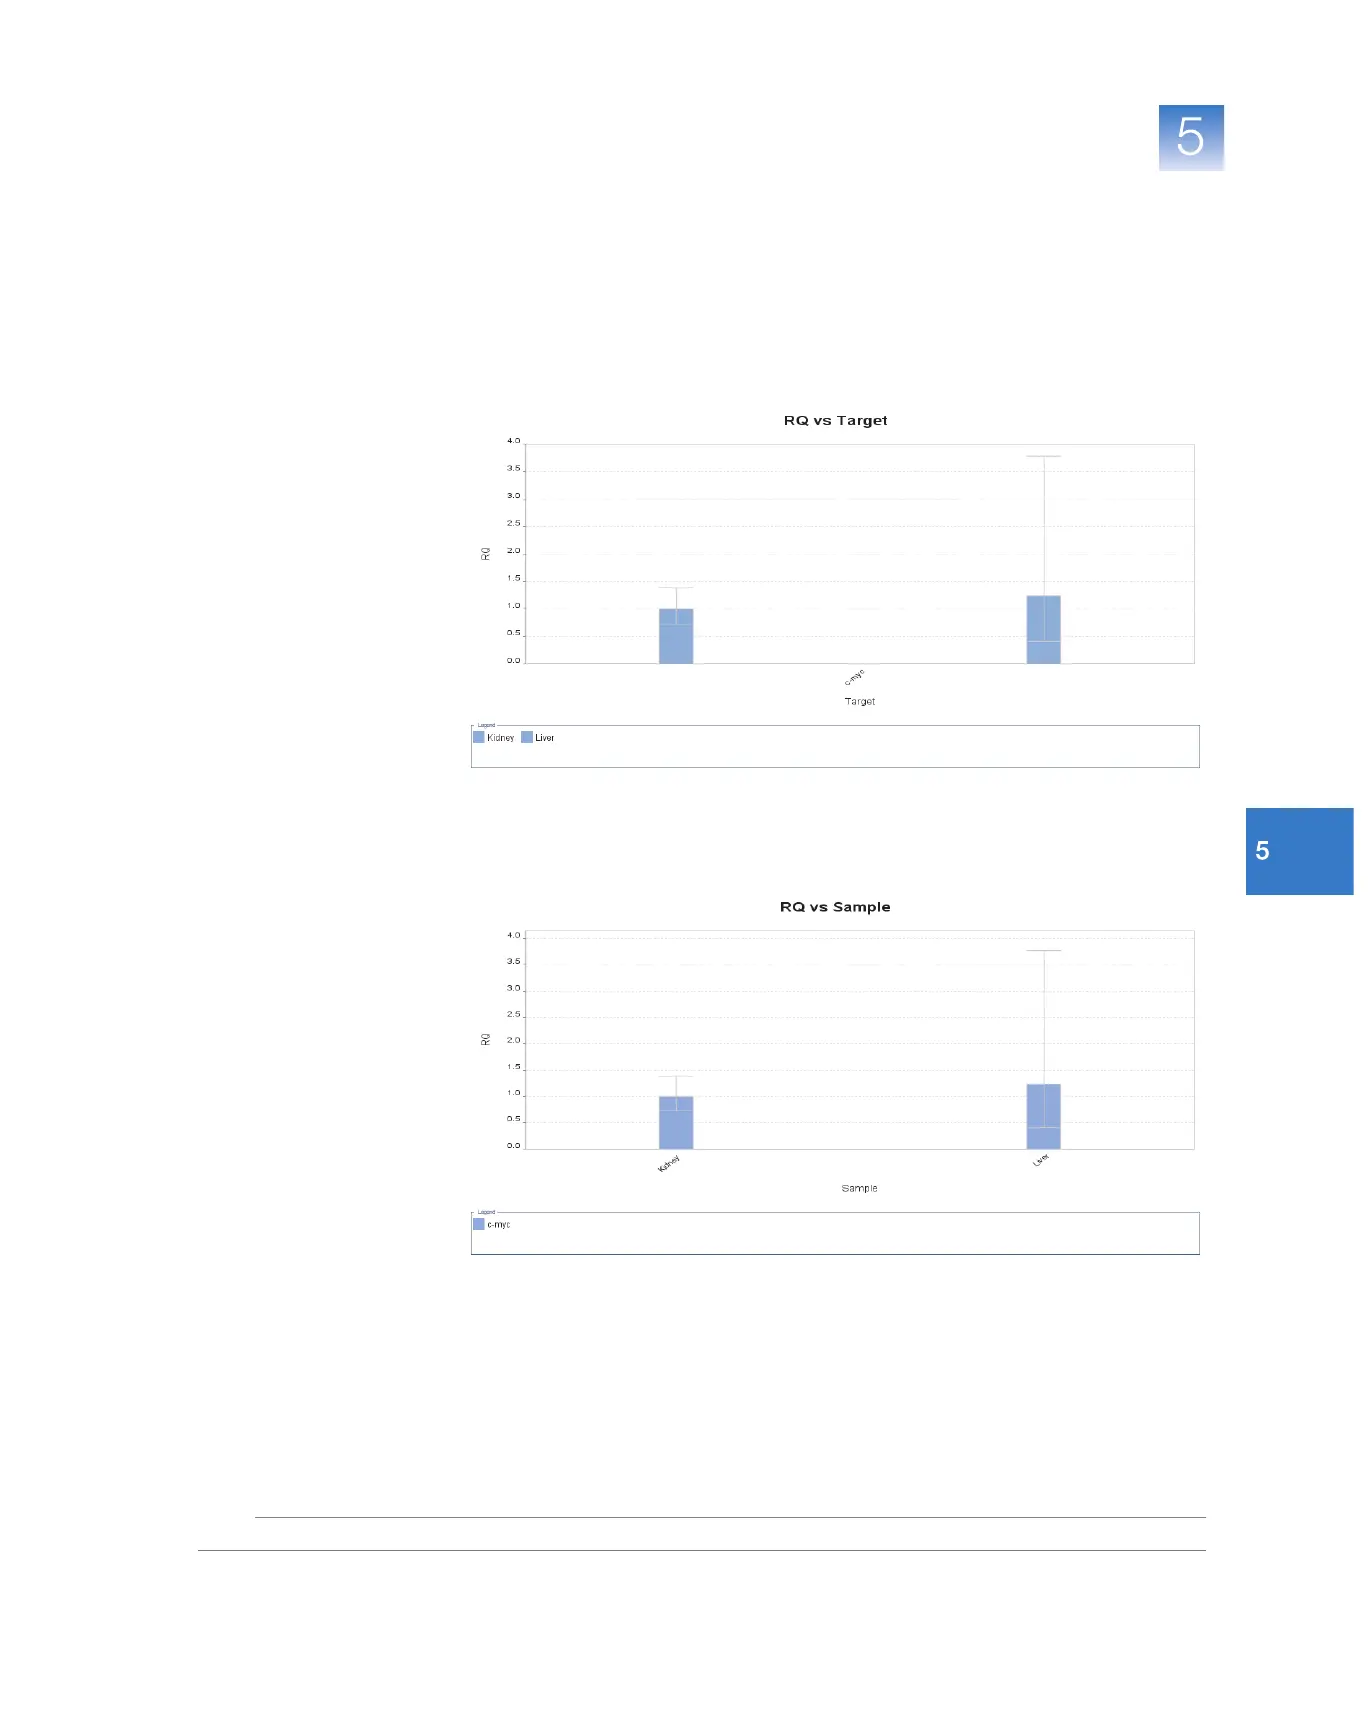
The Gene Expression Plot screen displays the results of relative quantitation calculations
in the gene expression profile. Two plots are available:
•
RQ vs Target
– Groups the relative quantitation (RQ) values by target. Each sample is
plotted for each target. You can display the plot on a linear, log10, Ln, or log2 scale.
• RQ vs Sample – Groups the relative quantitation (RQ) values by sample. Each
target is plotted for each sample. You can
display
the plot on a linear, log10, Ln, or
log2 scale.
The Well Table displays data for each well in the reaction plate, including:
• The sample name, target name, task, and dyes
• The calculated threshold cycle (C
T
), normalized fluorescence (Rn), and quantity
values
•Flags