Chapter 5 Analyze the Relative Standard Curve Experiment
Omit Wells from the Analysis
105
Applied Biosystems 7500/7500 Fast Real-Time PCR System Getting Started Guide for Relative Standard Curve
and Comparative C
T
Experiments
Notes
Omit Wells from the Analysis
Experimental error may cause some wells to be amplified insufficiently or not at all.
These wells typically produce C
T
values that differ significantly from the average for the
associated replicate wells. If included in the calculations, these outliers can result in
erroneous measurements; to ensure precision, omit the outliers from the analysis.
About the
Example
Experiment
In the example experiment, you use the Well Table to remove well A9 from the analysis.
The C
T
of well A9 deviates significantly from those of the related technical replicates,
which generated the HIGHSD flag due to the degree of variation in their C
T
values (see
“View the QC Summary” on page 103).
Omit Wells
1. In the navigation pane, select Analysis Amplification Plot.
Note: If no data are displayed, click Analyze.
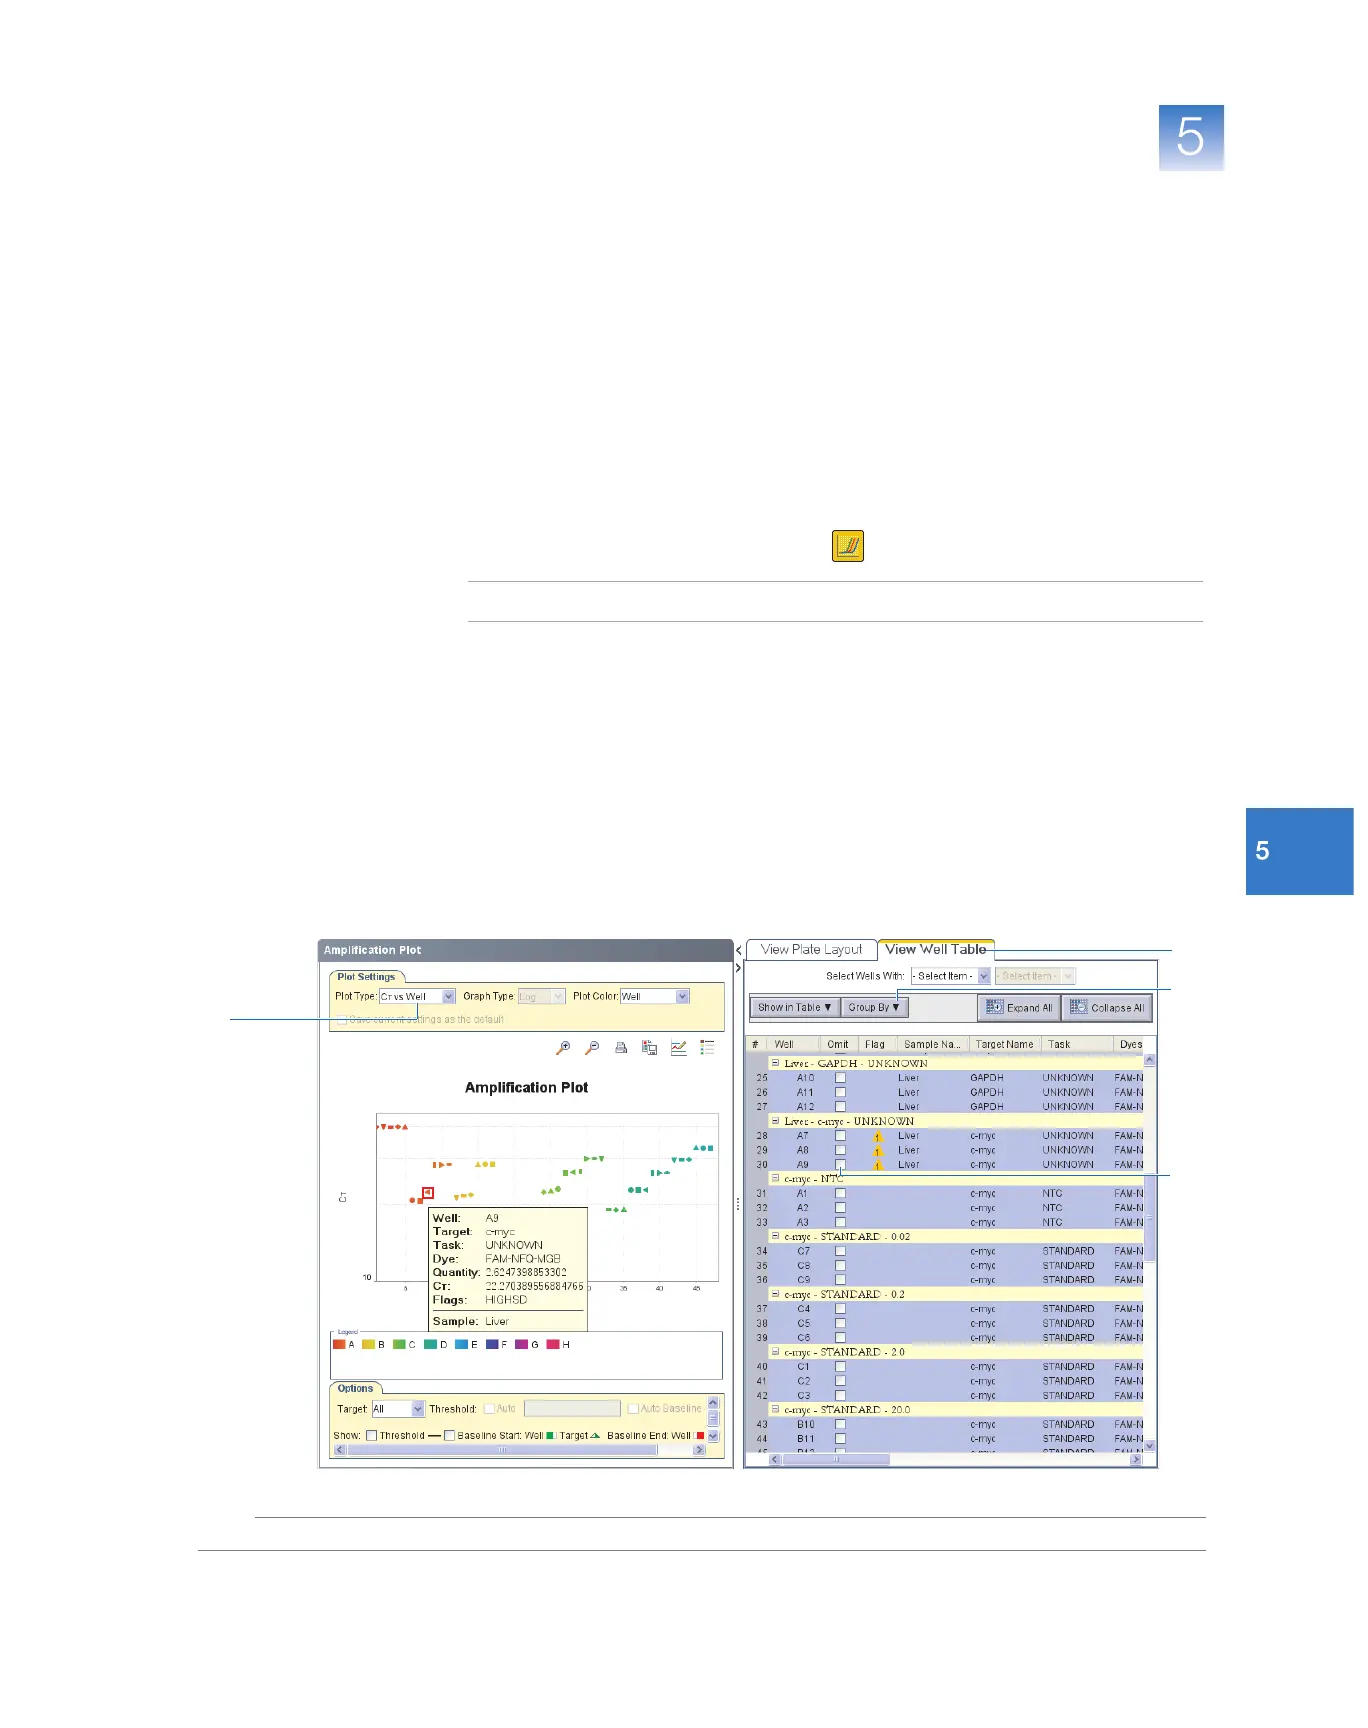
2.
In the Plot Type drop-down list, select
C
T
vs Well
.
3. Select the View Well Table tab.
4. In the Well Table:
a. In the Group By drop-down list, select Replicate.
b. Look for any outliers in the replicate group (be sure they are flagged). In the
example experiment, well A9 is the outlier.
c. Select the Omit check box next to well A9.
2
4a
4c
3