Chapter 9 Analyze the Comparative C
T
Experiment
View the Analysis Settings
Applied Biosystems 7500/7500 Fast Real-Time PCR System Getting Started Guide for Relative Standard Curve
and Comparative C
T
Experiments
176
Notes
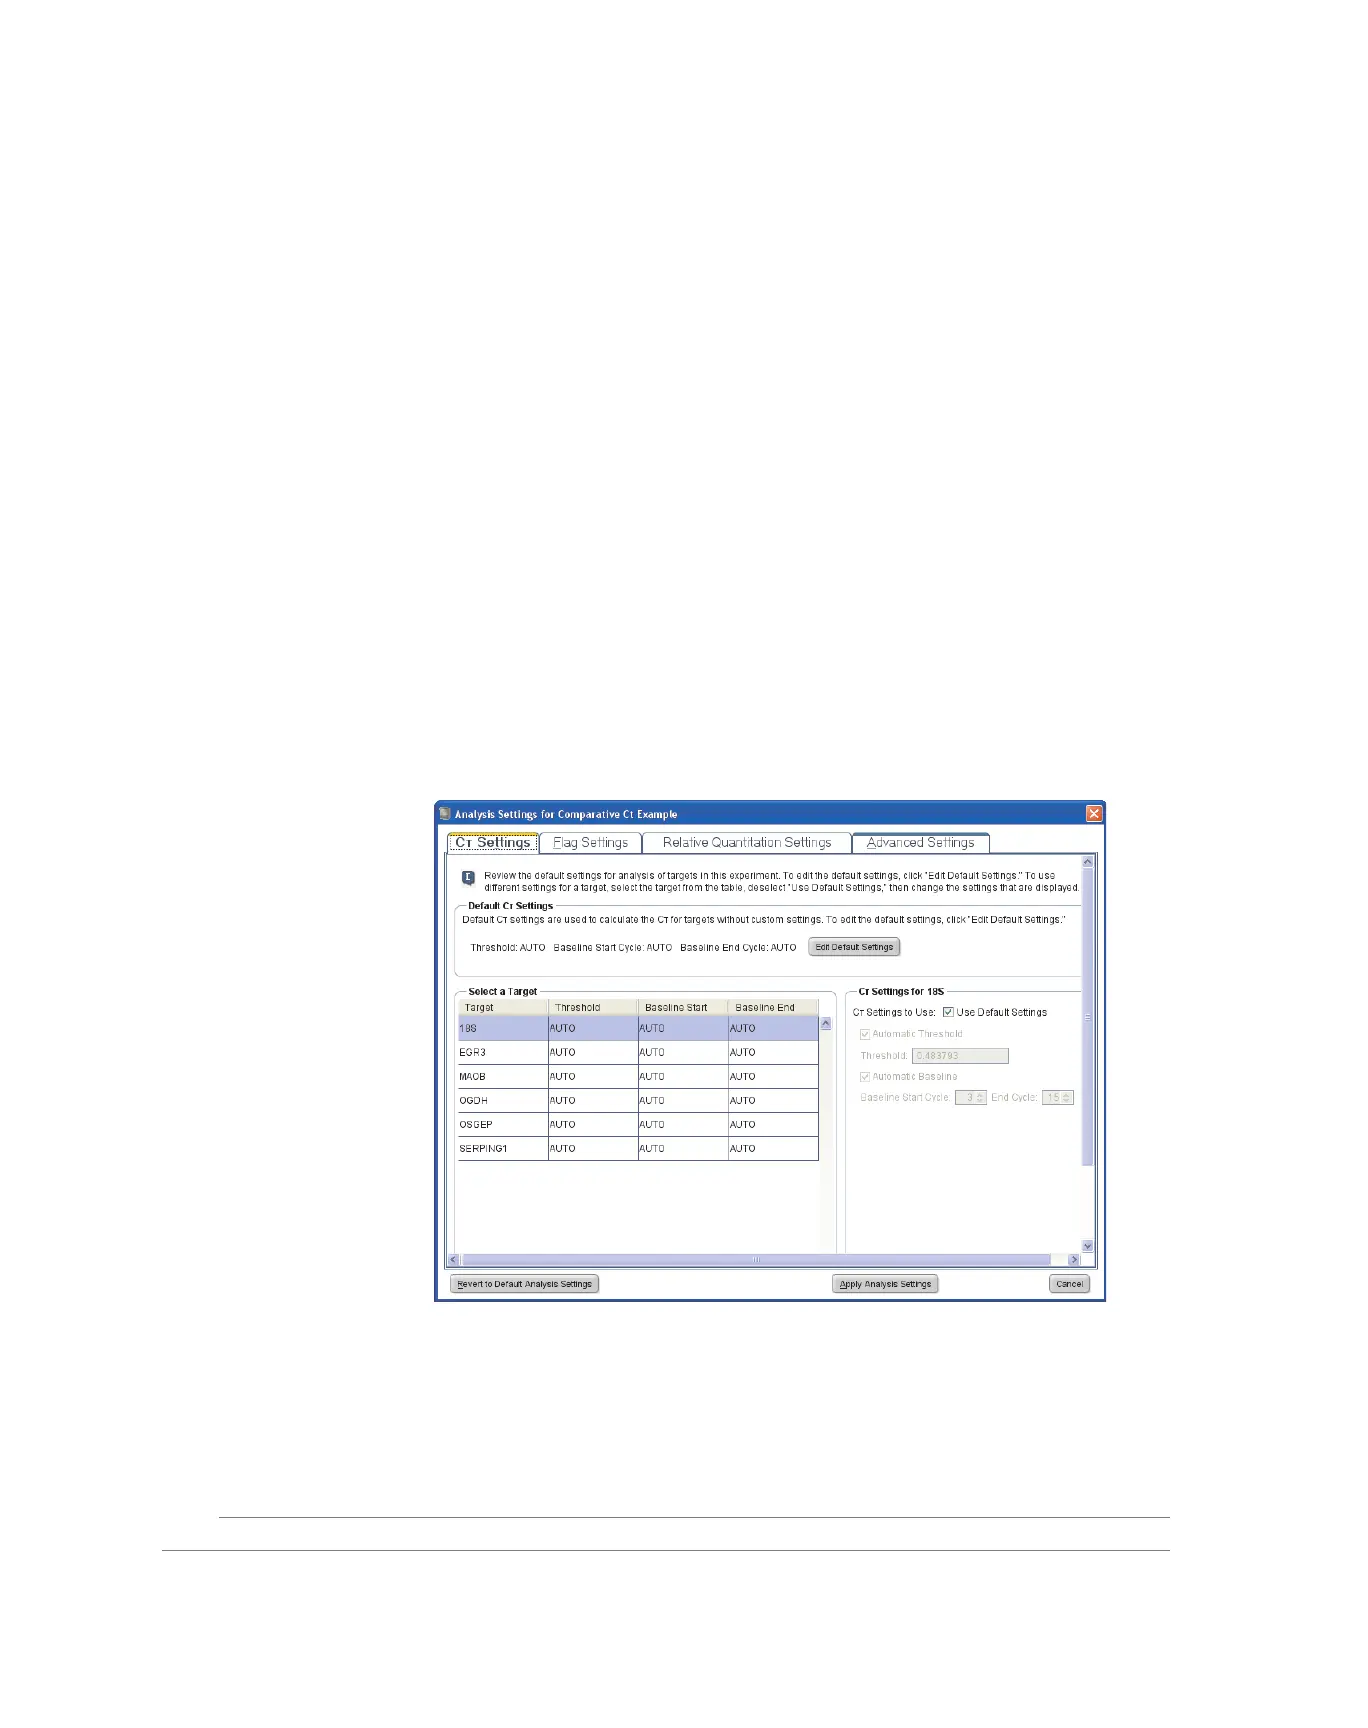
View the Analysis Settings
The Analysis Settings dialog box displays the analysis settings for the threshold cycle
(C
T
), flags, relative quantitation, and advanced options. If the default analysis settings in
the 7500 software are not suitable for your experiment, you can change the settings in the
Analysis Settings dialog box, then reanalyze your experiment.
About the
Example
Experiment
In the comparative C
T
example experiment, the default analysis settings are used without
changes.
View the Settings
1. In the navigation pane, select Analysis.
2. Click Analysis Settings to open the Analysis Settings dialog box.
In the example experiment, the default analysis settings are used from each of the
following tabs:
•C
T
Settings
• Flag Settings
• Relative Quantitation Settings
• Advanced Settings
3. Click Apply Analysis Settings.