Chapter 9 Analyze the Comparative C
T
Experiment
Analyze the Experiment
161
Applied Biosystems 7500/7500 Fast Real-Time PCR System Getting Started Guide for Relative Standard Curve
and Comparative C
T
Experiments
Notes
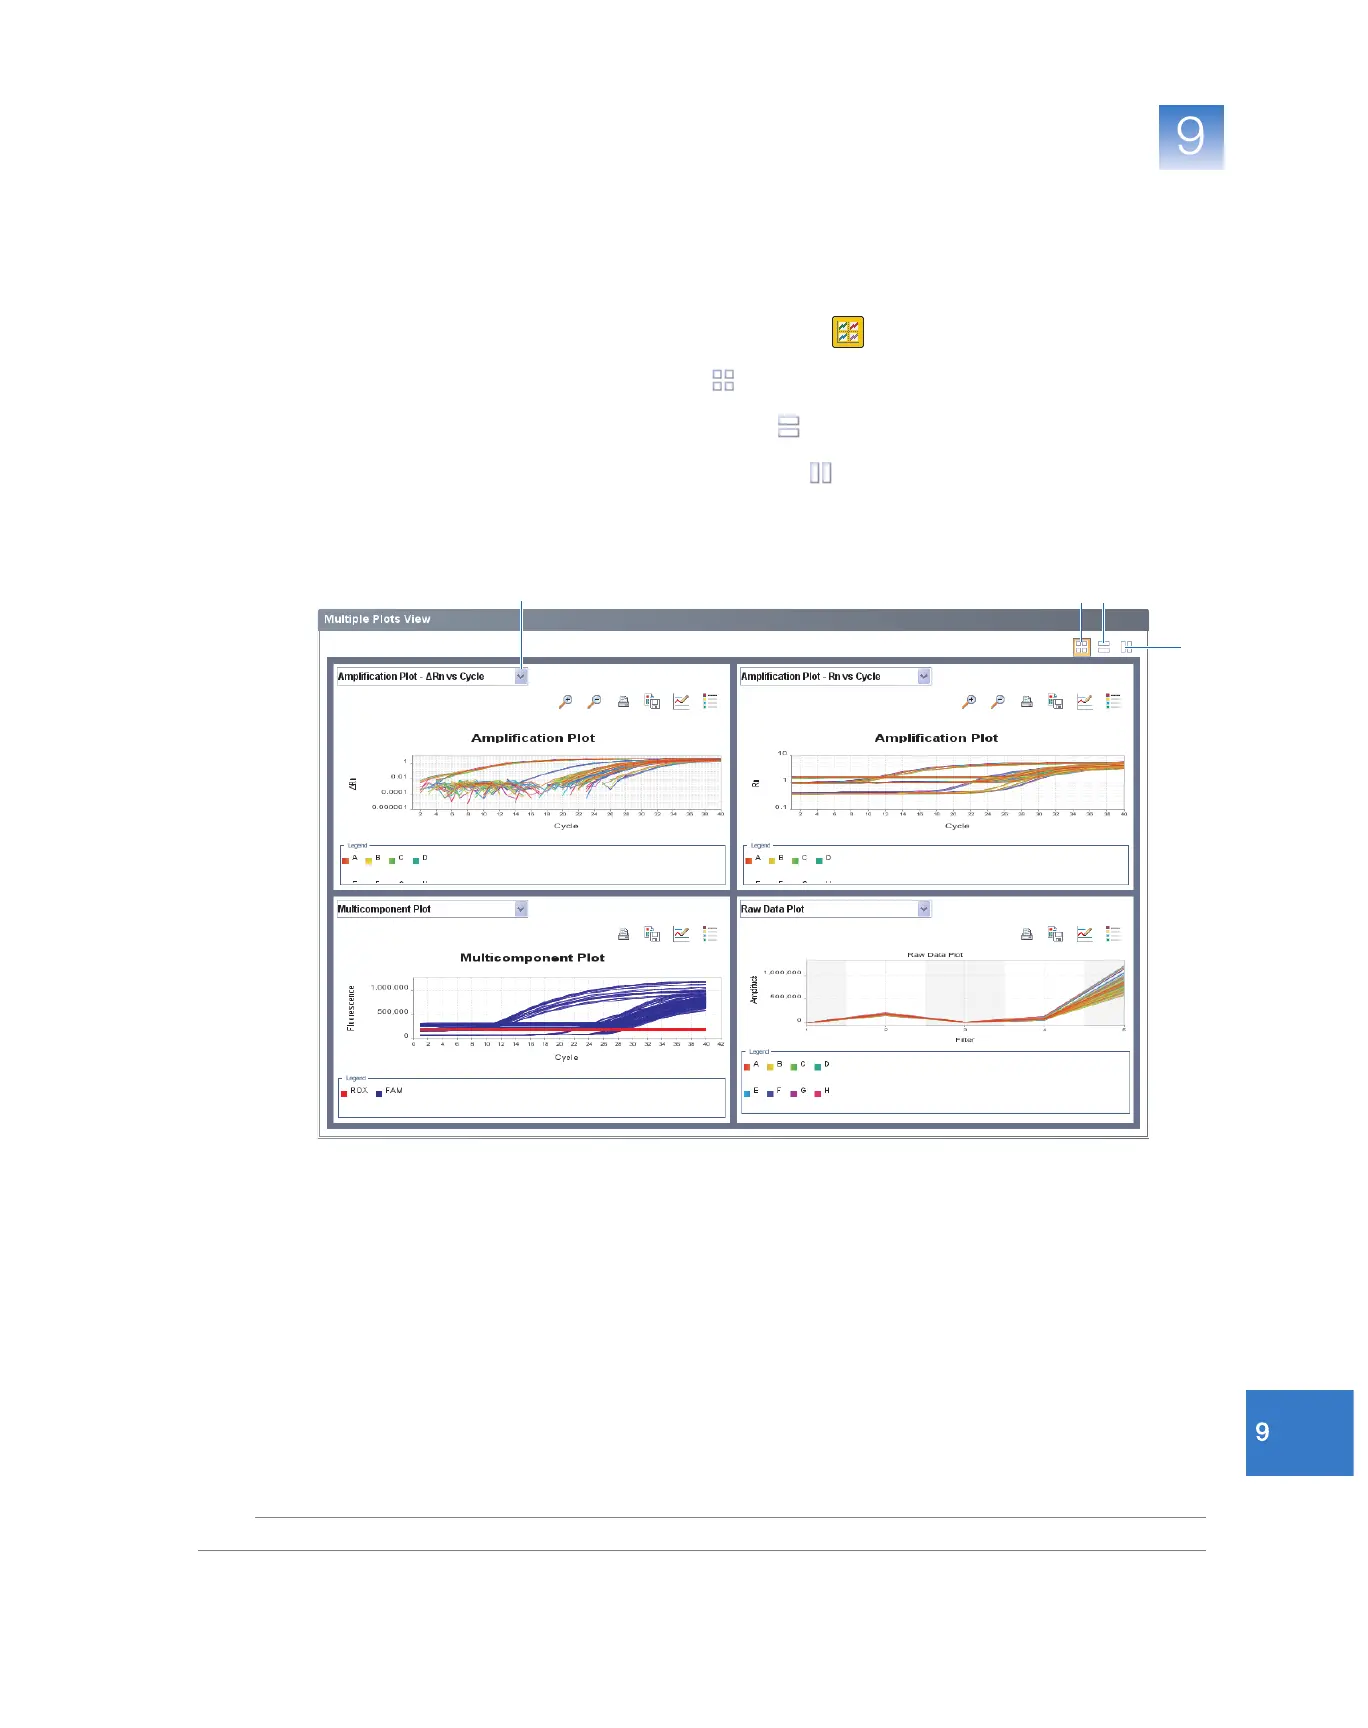
How to Display Multiple Plots
Use the Multiple Plots view to display up to four plots simultaneously. To navigate within
the Multiple Plots view:
1. In the navigation pane, select Analysis Multiple Plots View.
2. To display four plots, click (Show plots in a 2 5 2 matrix).
3. To display two plots in rows, click (Show plots in two rows).
4. To display two plots in columns, click (Show plots in two columns).
5. To display a specific plot, select the plot in the drop-down list above each plot
display.
4
2
3
5